- Find Answers
- :
- Splunk Administration
- :
- Monitoring Splunk
- :
- Dokumentation for "Health of Splunk Deployment" ca...
- Subscribe to RSS Feed
- Mark Topic as New
- Mark Topic as Read
- Float this Topic for Current User
- Bookmark Topic
- Subscribe to Topic
- Mute Topic
- Printer Friendly Page
- Mark as New
- Bookmark Message
- Subscribe to Message
- Mute Message
- Subscribe to RSS Feed
- Permalink
- Report Inappropriate Content
Dokumentation for "Health of Splunk Deployment" calculation
Hi all,
in splunk there is always this icon next to your user for the "Health of Splunk Deployment".
You can change these indicators and futures or their teshholds, but I can't find anything about what splunk actually does in the background to collect these values.
You can find something like this in health.conf:
- Mark as New
- Bookmark Message
- Subscribe to Message
- Mute Message
- Subscribe to RSS Feed
- Permalink
- Report Inappropriate Content
I created two Splunk Support cases related to another item on Splunk Health, and it would be simpler if these had better support documentation.
The item was actually Buckets, which is listed on health.conf as feature:buckets stanza with two indicators. One of them percent_small_buckets_created_last_24h
What I found was, on app splunk_instrumentation there is a savedsearch called [instrumentation.deployment.index] that writes these Metrics to _internal based on querying rest /services/data/indexes endpoint.
10-21-2021 12:02:06.956 +0100 INFO PeriodicHealthReporter - feature="Buckets" color=red indicator="percent_small_buckets_created_last_24h"And then there is a second savedsearch with stanza [instrumentation.usage.healthMonitor.currentState] that joins a table returned from rest endpoints with these logs read from _internal. The search returns a JSON structure with the overall Health Report stats.
Is this structure used to populate the Health Report on the Web Interface ? Unsure. As I said .. two tickets ..
- Mark as New
- Bookmark Message
- Subscribe to Message
- Mute Message
- Subscribe to RSS Feed
- Permalink
- Report Inappropriate Content
Do you guys still experiencing this error?
I can't get rid of it, event it looks everything's fine on my instance and OS.
THP are disabled.
Health Check does not report any issue with limits.
CPU usage is fine.
RAM usage is fine.
IOwait on disk is also fine.
Max measured values in the past 24h.
Any ideas?
- Mark as New
- Bookmark Message
- Subscribe to Message
- Mute Message
- Subscribe to RSS Feed
- Permalink
- Report Inappropriate Content
Nope for me I decide to adjust the threshold or disable this health check because it´s meaningless without documentation to find out how and how often splunk will check this iowait.
In generell I have no problems with my systems my searches are fast and I have no indexing delay so I think if you are interested in this the best option is to create a support case. I can´t find any searches which creates this data I think there is a "hidden" scripted input for this.
- Mark as New
- Bookmark Message
- Subscribe to Message
- Mute Message
- Subscribe to RSS Feed
- Permalink
- Report Inappropriate Content
Kan you post how/where you adjusted the threshold?
- Mark as New
- Bookmark Message
- Subscribe to Message
- Mute Message
- Subscribe to RSS Feed
- Permalink
- Report Inappropriate Content
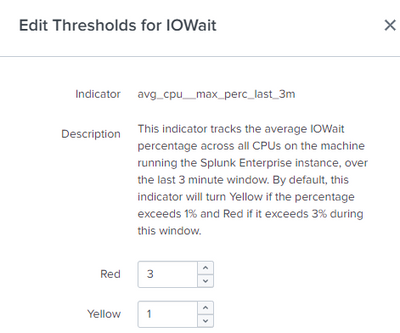
You can go to Settings --> "Health Report Manager" and then just search for iowait here you can enable the alert or edit the thresholds.
Or you can use the health.conf and copy the stanza to system local like:
- Mark as New
- Bookmark Message
- Subscribe to Message
- Mute Message
- Subscribe to RSS Feed
- Permalink
- Report Inappropriate Content
I also want to know the actual SPL used.
- Mark as New
- Bookmark Message
- Subscribe to Message
- Mute Message
- Subscribe to RSS Feed
- Permalink
- Report Inappropriate Content
See and control what is in the health report using the Health Report Manager at https://<localhost>:8000/en-US/manager/system/health/manager
You can read about the health report at https://docs.splunk.com/Documentation/Splunk/8.1.2/DMC/Aboutfeaturemonitoring?ref=hk
If this reply helps you, Karma would be appreciated.
- Mark as New
- Bookmark Message
- Subscribe to Message
- Mute Message
- Subscribe to RSS Feed
- Permalink
- Report Inappropriate Content
Yes this is ok, but if I take a look to /en-US/manager/system/health/manager or the documentation I found nothing about the calculation for the threshold and the link to the feature monitorings also don´t provide any information these data and calculation or I am blind.
Maybe two examples:
In this Screenshot you can see the an error and some related INFO messages for this behavior to understand why this indicator is yellow or red.
So I expect there is an alert savedsearch or something else like index=_internal sourcetype=splunkd component="CMMaster" "streaming error" | stats count as count | eval thresshold=if(count<10,"yellow","red")
If you don´t have the information why the indicator is red or yellow the meaning of the indicator can be everything
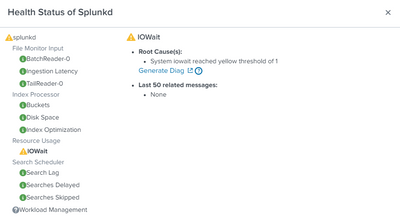
2. You got an error like this:
So how do you troubleshoot this warning or error? The only information you have is "System iowait reached yellow threshold of 1" , but I can not find anything on which data splunk calculates this information or how this data was generated.
The only thing I can find is the settings of the thresholds, but nothing about the calculation for these threshholds what makes an alert for me meaningsless
- Mark as New
- Bookmark Message
- Subscribe to Message
- Mute Message
- Subscribe to RSS Feed
- Permalink
- Report Inappropriate Content
I understand what you're asking for now. I think you'll find the information you seek in $SPLUNK_HOME/etc/system/default/health.conf.
If this reply helps you, Karma would be appreciated.
- Mark as New
- Bookmark Message
- Subscribe to Message
- Mute Message
- Subscribe to RSS Feed
- Permalink
- Report Inappropriate Content
Unfortunately no, in this configuration you can only see what the indicator should stand for, but not how the data is collected and evaluated, but I have made some progress and I was able to find out that in the app splunk_instrumentation the following searches are for it:
instrumentation.usage.healthMonitor.report
instrumentation.usage.healthMonitor.currentState
And in the currentState search is the join to the data from the health.log for the Treshhold
index=_internal earliest=-1d source=*health.log component=PeriodicHealthReporter node_path=splunkd.resource_usage.iowait
In this case you can replace the iowait with the feature you want to look at in more detail
The last step that is still missing is how splunk generates the health.log, since the state is already created in this case for the evaluation.
- Mark as New
- Bookmark Message
- Subscribe to Message
- Mute Message
- Subscribe to RSS Feed
- Permalink
- Report Inappropriate Content
Hi,
Please run below to get the iowait usage that is being tracked by splunk by default:
index=_introspection sourcetype=splunk_resource_usage component=IOWait
Looks like they are taking it from there.
Regards,
BK


