- Find Answers
- :
- Splunk Administration
- :
- Admin Other
- :
- Knowledge Management
- :
- In summary indexing, why does the sitimechart give...
- Subscribe to RSS Feed
- Mark Topic as New
- Mark Topic as Read
- Float this Topic for Current User
- Bookmark Topic
- Subscribe to Topic
- Mute Topic
- Printer Friendly Page
- Mark as New
- Bookmark Message
- Subscribe to Message
- Mute Message
- Subscribe to RSS Feed
- Permalink
- Report Inappropriate Content
Hello,
I'm attempting to use summary indexing to store the following search that shows timechart average cpu usage for a group of servers:
index=perfmon host="UW2*" | timechart span=1h avg(cpu_load_percent) by host
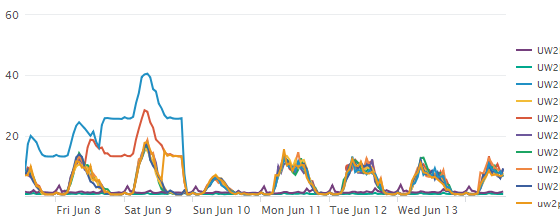
It looks like this:
When I try to use summary indexing to save this search as a report using sitimechart, the results are completely different:
index=perfmon host="UW2*" | sitimechart span=1h avg(cpu_load_percent) by host
It looks like timechart and sitimechart behave differently. Why is this? How can I get the same results from sitimechart that I get with timechart?
- Mark as New
- Bookmark Message
- Subscribe to Message
- Mute Message
- Subscribe to RSS Feed
- Permalink
- Report Inappropriate Content
The si commands - sitimechart, sitop, sistats etc all save data in what is basically a serialized format called colloquially the "prestats" format. You get new fields that are named with things like psrsvd_X - these contain the "sufficient statistics" needed to make a summary index work. Depending on the functions in your stats (or timechart - remember that timechart is really just "stats with a funny hat") command, it may need to save different things in order to reconstruct a final result over your summary.
For example, if you're summarizing count() or sum() then it's pretty each to just store the number or items counted, or the sum of them. The sum of a set of sums is still something you just add up. But, average is different. If Splunk stored the average at each "sample" of the summary index, then averaged-the-averages you'd get a very close but not mathematically accurate summarization. Instead, Splunk stores what the average is made of -- a count and a sum.
For some experimentation and an example, I'm using this metrics log data everyone has:
index=_internal source=*metrics.log group=queue | sitimechart span=1h avg(current_size_kb) by name
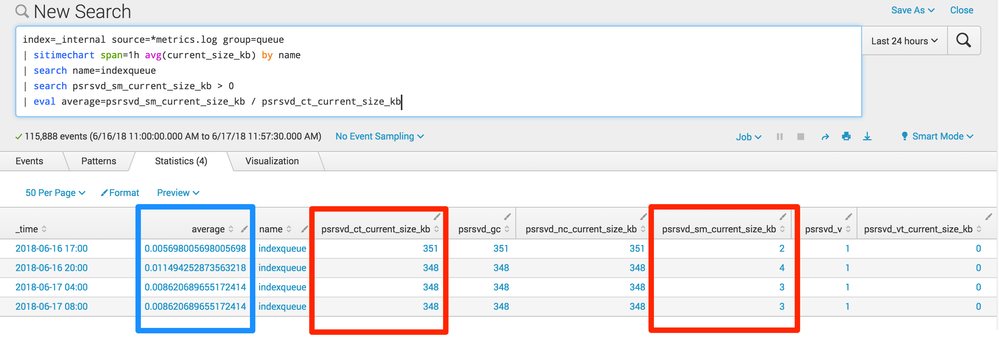
When I run this, I get a result with some funny psrsvd fields in it, like psrsvd_ct_current_size_kb and psrsvd_sm_current_size_kb. There are some others too, but I want to focus on these two. These are, during the generation of the summary, the count and the sum. Let's do some experimentation:
index=_internal source=*metrics.log group=queue
| sitimechart span=1h avg(current_size_kb) by name
| search name=indexqueue
| search psrsvd_sm_current_size_kb > 0
| eval average=psrsvd_sm_current_size_kb / psrsvd_ct_current_size_kb
I am taking the output of my sitimechart and manually recreating the definition of average by dividing sum by count. Then we'll compare it to basically the same data intimechart.
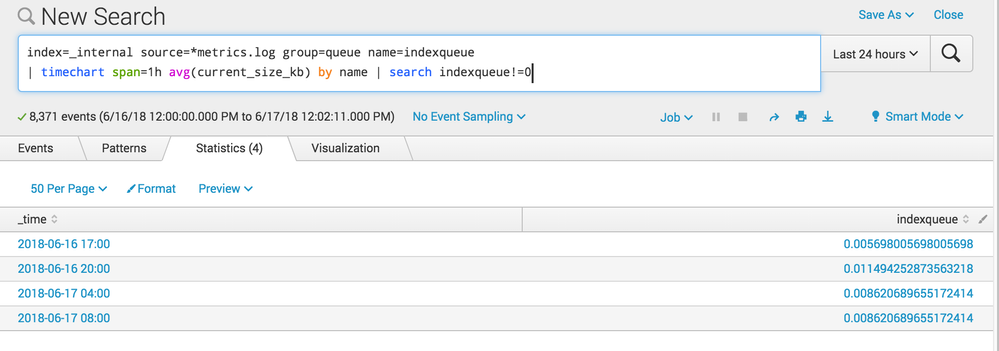
Now I'll run a very similar, but not identical, search using just timechart.
index=_internal source=*metrics.log group=queue name=indexqueue
| timechart span=1h avg(current_size_kb) by name
| search indexqueue!=0
Cool, the exact same averages. Part of the point here is that my summary index generation parameters and my summary index usage parameters can be a little different and the maths still work out to be reasonable. Like, if I'm collecting CPU usage on an hourly average, then I can report on it with an hourly average, or a daily average, or a weekly average or whatever -- it's just a question of how many different values of "count" and "sum" that I add up in order to compute an average. (Note this is only true when you roll up to larger time windows - I can't take an hourly sample of average CPU and use that to derive a per-minute average). This helps you understand why Splunk stores summary index data in this strange prestats serialized format - its more flexible for reporting on later, even if it's not easily human readable.
While I was writing this, I set up a summary index to run as follows:
index=_internal source=*metrics.log group=queue
| sitimechart span=1m avg(current_size_kb) by name
This is in a scheduled search named "test", scheduled for every hour over the past hour. If I look at the data in the summary index,
index=summary search_name="test"
I see it's in the prestats format, like so:
06/17/2018 12:14:00 -0500, search_name=test, search_now=1529255700.000, info_min_time=1529252100.000, info_max_time=1529255700.000, info_search_time=1529255700.170, name=udp_queue, psrsvd_ct_current_size_kb=2, psrsvd_gc=2, psrsvd_nc_current_size_kb=2, psrsvd_sm_current_size_kb=0, psrsvd_v=1, psrsvd_vt_current_size_kb=0
Now I can use a "regular timechart" to get data out of the summary and present it in a sane visualization:
index=summary search_name="test"
| timechart span=1h avg(current_size_kb) by name
Hopefully this helps as a walkthrough of what is happening and lets you figure out where you've got things askew.
- Mark as New
- Bookmark Message
- Subscribe to Message
- Mute Message
- Subscribe to RSS Feed
- Permalink
- Report Inappropriate Content
Thank you for the in-depth explanation! This is very helpful. I will review and test it out.
- Mark as New
- Bookmark Message
- Subscribe to Message
- Mute Message
- Subscribe to RSS Feed
- Permalink
- Report Inappropriate Content
Tested this morning with no issues. Thanks again!
- Mark as New
- Bookmark Message
- Subscribe to Message
- Mute Message
- Subscribe to RSS Feed
- Permalink
- Report Inappropriate Content
You have not provided enough information to enable anyone to help you solve your problem. It is likely you are misusing the sitimechart command, and/or have not made your summary generation search correctly.
Share with us:
[1] The search you are using to make your summary index
[2] The search you are using to pull data from your summary index
- Mark as New
- Bookmark Message
- Subscribe to Message
- Mute Message
- Subscribe to RSS Feed
- Permalink
- Report Inappropriate Content
Hi dwaddle, maybe I'm misunderstanding your request, but I included both searches above.
index=perfmon host="UW2*" | sitimechart span=1h avg(cpu_load_percent) by host
^ to create summary index
index=summary host="UW2*" | timechart span=1h avg(cpu_load_percent) by host
^ to pull from summary
- Mark as New
- Bookmark Message
- Subscribe to Message
- Mute Message
- Subscribe to RSS Feed
- Permalink
- Report Inappropriate Content
OH I missed them, MY APOLOGIES! Well that is strange, as you seem to have done it right. Let me do some more digging
- Mark as New
- Bookmark Message
- Subscribe to Message
- Mute Message
- Subscribe to RSS Feed
- Permalink
- Report Inappropriate Content
Hi @dtrelford,
What about the statistics tab ? The avg should be same for a timestamp for both commands.
SI-* commands add additional fields to the result to summarize as mentioned in http://docs.splunk.com/Documentation/Splunk/7.1.1/Knowledge/Usesummaryindexing#Fields_added_to_summa...
What goes around comes around. If it helps, hit it with Karma 🙂
- Mark as New
- Bookmark Message
- Subscribe to Message
- Mute Message
- Subscribe to RSS Feed
- Permalink
- Report Inappropriate Content
Here's the statistics tab for both, with the same timestamp. The CPU avg usage of 1.02% is what I'm looking to timechart. That value is not present in the sitimechart statistic results:
timechart:
_time UW2SERVER01
2018-06-17 09:00 1.0268111210652904
sitimechart:
_time host psrsvd_ct_cpu_load_percent psrsvd_gc psrsvd_nc_cpu_load_percent psrsvd_sm_cpu_load_percent psrsvd_v psrsvd_vt_cpu_load_percent
2018-06-17 09:00 UW2SERVER01 75 2243 75 80.72541951731340000000000 1 23


