- Find Answers
- :
- Splunk Administration
- :
- Getting Data In
- :
- Why is Data not displayed even though the query pr...
- Subscribe to RSS Feed
- Mark Topic as New
- Mark Topic as Read
- Float this Topic for Current User
- Bookmark Topic
- Subscribe to Topic
- Mute Topic
- Printer Friendly Page
- Mark as New
- Bookmark Message
- Subscribe to Message
- Mute Message
- Subscribe to RSS Feed
- Permalink
- Report Inappropriate Content
Why is Data not displayed even though the query previously worked?
Hello all,
I am still relatively new to the topic of Splunk and SPL.
To show the maximum uptime per day of four hosts in a bar chart, I wrote the following query:
sourcetype=datacollection VMBT02 OR slaznocaasevm01 OR VMMS01 OR slaznocaasmon01
| rex "Uptime: (?<hours>\d+) hours (?<minutes>\d+) minutes"
| rex "Uptime: (?<minutes>\d+) minutes (?<seconds>\d+) seconds"
| eval hours = coalesce(hours, 0)
| eval minutes = coalesce(minutes, 0)
| eval seconds = coalesce(seconds, 0)
| eval uptime_decimal = if(minutes > 0 AND seconds > 0, minutes/1000 * 10, hours*1 + minutes/100)
| eval formatted_uptime = round(uptime_decimal, 2)
| where extracted_hostname IN ("VMBT02", "slaznocaasevm01", "VMMS01", "slaznocaasmon01")
| stats max(formatted_uptime) as Uptime by extracted_Hostname
I extracted the field "extracted_hostname" via the GUI before. There are also no events here that do not match the regex. Afterwards, the chart is also displayed correctly.
However, the field extraction does not work from the 01st to about the 10th of a month. Instead of the hostnames, other data fragments from the first line of an event are taken here. I can't see a pattern here either.
Does anyone know where the causes for the incorrect extraction are? Is perhaps my query incorrect?
I hope someone can help me to solve this problem.
Thanks in advance
Many greetings
- Mark as New
- Bookmark Message
- Subscribe to Message
- Mute Message
- Subscribe to RSS Feed
- Permalink
- Report Inappropriate Content
Oh wow, I really hadn't thought of that at all.
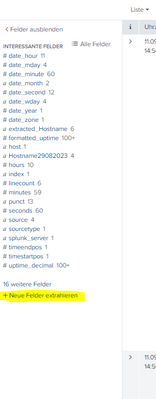
I started the extraction via here and followed the steps shown:
- ...
- Mark as New
- Bookmark Message
- Subscribe to Message
- Mute Message
- Subscribe to RSS Feed
- Permalink
- Report Inappropriate Content
Please provide the field extraction itself, as defined in props.conf or transforms.conf.
If this reply helps you, Karma would be appreciated.
- Mark as New
- Bookmark Message
- Subscribe to Message
- Mute Message
- Subscribe to RSS Feed
- Permalink
- Report Inappropriate Content
Hello richgalloway,
thank you for your answer. I did the extraction in props.conf and transforms.conf. However, I cannot find or access the extracted field in the Splunk interface.
Here's what I wrote in transforms.conf:
[extract_host]
REGEX = ^(?:[^ \n]* ){9}\w+\d+\s+(?P<newhostname>\w+)
FORMAT = newhostname::$1
The following in props.conf
[sourcetype::Datacollection]
TRANSFORMS-extract_host = extract_host
Did I do something wrong here?
Thanks for your answer in advance.
Sharon
- Mark as New
- Bookmark Message
- Subscribe to Message
- Mute Message
- Subscribe to RSS Feed
- Permalink
- Report Inappropriate Content
Can you also please share a couple of sanitized events so we can check the regex?
If this reply helps you, Karma would be appreciated.
- Mark as New
- Bookmark Message
- Subscribe to Message
- Mute Message
- Subscribe to RSS Feed
- Permalink
- Report Inappropriate Content
Here are some sample events. One per host:
Mon Sep 25 13:22:14 UTC 2023 - Host: slaznocaasmon01 slaznocaasmon01;Check_MK HW/SW Inventory;Found 86 inventory entries, Found 18 status entries ;0; slaznocaasmon01;Systemd Service Summary;Total: 179, Disabled: 17, Failed: 1, 1 static service failed (dnf-makecache)(!!);2; slaznocaasmon01;OMD nocaas apache;0.02 Requests/s, 0.00 Seconds serving/s, 0.52 B Sent/s;0; slaznocaasmon01;Check_MK Discovery;no unmonitored services found, no vanished services found, no new host labels ;0; slaznocaasmon01;Mount options of /var;Mount options exactly as expected;0; slaznocaasmon01;Mount options of /usr;Mount options exactly as expected;0;
Mon Sep 25 13:22:04 UTC 2023 - Host: slaznocaasevm01 slaznocaasevm01;Check_MK Discovery;no unmonitored services found, no vanished services found, no new host labels ;0; slaznocaasevm01;Disk IO SUMMARY;Read: 0.00 B/s, Write: 862 kB/s, Latency: 508 microseconds;0; slaznocaasevm01;Filesystem /var;37.37% used (2.99 of 7.99 GB), trend: -27.75 MB / 24 hours;0; slaznocaasevm01;Filesystem /usr;41.03% used (4.10 of 9.99 GB), trend: +128.74 kB / 24 hours;0; slaznocaasevm01;Filesystem /mnt;5.3% used (1.66 of 31.37 GB), trend: 0.00 B / 24 hours;0; slaznocaasevm01;Filesystem /home;28.35% used (287.49 of 1014.00 MB), trend: +16.26 kB / 24 hours;0;
Hostnames are: slaznocaasevm01, slaznocaasmon01, VMMS01 and VMBT02
- Mark as New
- Bookmark Message
- Subscribe to Message
- Mute Message
- Subscribe to RSS Feed
- Permalink
- Report Inappropriate Content
Try this transform
[extract_host]
REGEX = Host:\s\w+\d+\s+(\w+)
FORMAT = newhostname::$1
If this reply helps you, Karma would be appreciated.
- Mark as New
- Bookmark Message
- Subscribe to Message
- Mute Message
- Subscribe to RSS Feed
- Permalink
- Report Inappropriate Content
Please share how the extracted_hostname field is extracted (with more detail than "via the GUI"). It sounds like the extraction makes an assumption that applies only with two-digit dates.
If this reply helps you, Karma would be appreciated.


