Join the Conversation
- Find Answers
- :
- Splunk Administration
- :
- Getting Data In
- :
- Why are infrastructure disk writes different than ...
- Subscribe to RSS Feed
- Mark Topic as New
- Mark Topic as Read
- Float this Topic for Current User
- Bookmark Topic
- Subscribe to Topic
- Mute Topic
- Printer Friendly Page
- Mark as New
- Bookmark Message
- Subscribe to Message
- Mute Message
- Subscribe to RSS Feed
- Permalink
- Report Inappropriate Content
Why are infrastructure disk writes different than indexing rate in Splunk?
Hello All,
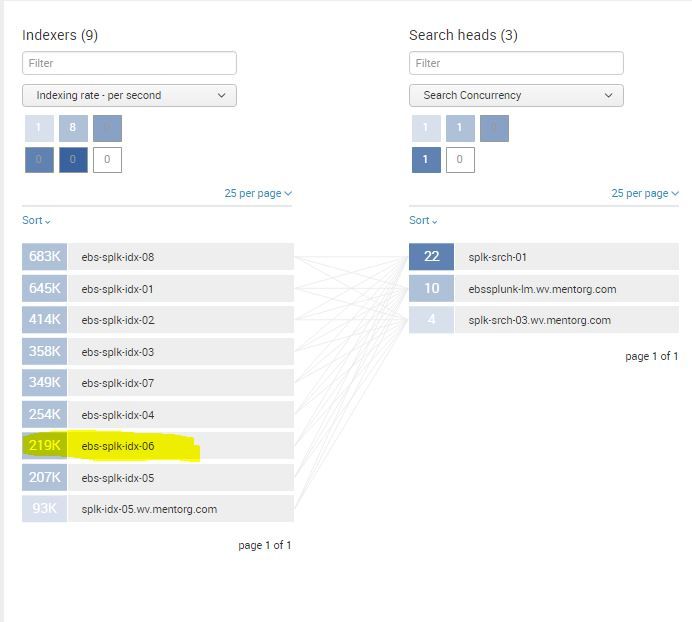
Basically, I am confused as to what is actually happening in our environment. VMware shows that we are roughly writing at 6MB/s and Splunk Distributed Management Console shows indexing rate of 219KB/s. So what is actually happening to magnify the writes so much?
- Mark as New
- Bookmark Message
- Subscribe to Message
- Mute Message
- Subscribe to RSS Feed
- Permalink
- Report Inappropriate Content
VM ware looks at the entire OS disk reads and writes. Slunk only considers it's own read write activity not of the entire disk /spinals read writes. Your disk are in array? I image they are and different parts of the disk spindles could be used in another vm.. but that's off topic... I think this could be the discrepancy. .. you could open resource monitor.. go to disk. Sort and calculate the splunk service disk activities and see if it roughly adds up to the index rate in the DMC on it indexer
- Mark as New
- Bookmark Message
- Subscribe to Message
- Mute Message
- Subscribe to RSS Feed
- Permalink
- Report Inappropriate Content
The indexing rate only estimated indexing volume. Splunk searches, writing logs, optimizing/rolling buckets, and all other activities are not included. I'm not familiar with VM's measurement. So, I cannot tell what VMware's measurement procedure and time range etc. Will VM guest iostat meet with the VMware's measurement? If so, probably that's what you need to compare.


