Join the Conversation
- Find Answers
- :
- Splunk Administration
- :
- Getting Data In
- :
- Re: Unable to pull backlog data through TA-ms-loga...
- Subscribe to RSS Feed
- Mark Topic as New
- Mark Topic as Read
- Float this Topic for Current User
- Bookmark Topic
- Subscribe to Topic
- Mute Topic
- Printer Friendly Page
- Mark as New
- Bookmark Message
- Subscribe to Message
- Mute Message
- Subscribe to RSS Feed
- Permalink
- Report Inappropriate Content
I have setup the TA-ms-loganalytics on my Splunk enterprise instance, and configured the inputs, i have given the start_date as 08/04/2020 00:00:00 in my inputs configuration, the current data flow (13/07/2020) is coming fine, but the count is very less OR zero for the past month dates, i validated the events/data are present there in my azure for the respective dates. below is my inputs.conf
[log_analytics://SourceLogs1_Backlog]
application_id = XXXXXXXXXXXXXXXXXXXXXXXXXXXXXXXXX
application_key = **************************
event_delay_lag_time = 15
index = myindex
sourcetype = mysourcetype
interval = 300
log_analytics_query = AuditLogs | where ResourceGroup != ""
resource_group = AAAA-BBB-CC
start_date = 08/04/2020 00:00:00
subscription_id = XXXXXXX-XXXXXX-XXXXX-XXXX-XXXXX
tenant_id = XXXXXXX-XXXXXX-XXXXX-XXXX-XXXXX
workspace_id = XXXXXXX-XXXXXX-XXXXX-XXXX-XXXXX
disabled = 0
[log_analytics://SourceLogs2_Backlog]
application_id = XXXXXXXXXXXXXXXXXXXXXXXXXXX
application_key = ***************************************
event_delay_lag_time = 15
index = myindex
sourcetype = mysourcetype
interval = 300
log_analytics_query = AzureDiagnostics | where ResourceGroup != ""
resource_group = AAAA-BBB-CC
start_date = 08/04/2020 00:00:00
subscription_id = XXXXXXX-XXXXXX-XXXXX-XXXX-XXXXX
tenant_id = XXXXXXX-XXXXXX-XXXXX-XXXX-XXXXX
workspace_id = XXXXXXX-XXXXXX-XXXXX-XXXX-XXXXX
disabled = 0
- Mark as New
- Bookmark Message
- Subscribe to Message
- Mute Message
- Subscribe to RSS Feed
- Permalink
- Report Inappropriate Content
Hi @jkat54.
I used this and able to pull JSON format data by direct API call.
https://api.loganalytics.io/v1/workspaces/{{workspace_id}}/query?query=AzureDiagnostics | where ResourceGroup != "" | where TimeGenerated between(datetime("2020-04-08 00:00:00") .. datetime("2020-04-12 23:59:59"))
- Mark as New
- Bookmark Message
- Subscribe to Message
- Mute Message
- Subscribe to RSS Feed
- Permalink
- Report Inappropriate Content
@jkat54 appreciate if you could help here.
- Mark as New
- Bookmark Message
- Subscribe to Message
- Mute Message
- Subscribe to RSS Feed
- Permalink
- Report Inappropriate Content
You need to increase the lag time because azure will not guarantee TIMELINESS of their data delivery to the underlying storage mechanisms the OMS / Log Analytics Data is stored in.
The default lag is supposed to be 15 minutes. It looks like you're configured for 15 seconds.
make your lag time a function of your interval. If you collect data every 5 minutes (default), then your lag should be at least twice the interval, but in most cases, people are setting lag to 900-1800
- Mark as New
- Bookmark Message
- Subscribe to Message
- Mute Message
- Subscribe to RSS Feed
- Permalink
- Report Inappropriate Content
Hi
i changed it to 900 seconds to make it 15mins, and the data flow has been stopped now. i am not receiving any events. I am not seeing any errors as well.
- Mark as New
- Bookmark Message
- Subscribe to Message
- Mute Message
- Subscribe to RSS Feed
- Permalink
- Report Inappropriate Content
Ok, i can see the logs being indexed, will monitor for sometime now, to see if it started capturing the logs for past months.
- Mark as New
- Bookmark Message
- Subscribe to Message
- Mute Message
- Subscribe to RSS Feed
- Permalink
- Report Inappropriate Content
Hi @jkat54,
Here is a scenario is that my OMS/Log Analytics has been stored data past 150 days i we just configure lag is 900 seconds =15 minutes and Interval = 300 seconds = 5 mints but i can noticed that data has been pulling but it has been huge delay. Also it has been pulling only past 1 months data but not pulling data for past 5 months.
Hence i took lag as 360 seconds = 6 minutes and interval is 180 minutes= 3 minutes i can see little fast data pulling but it pulling past 30 days only & pulling is in progress. Still we have data available past 5 months and we have Startdate as i put exactly before 5 months.
I don't know it will pull 5 months data or not? As i can see only it's pulling data from current time to past 1 month and current time to future time.
Could you please guide me how could i pull the data only for past 5 months?
- Mark as New
- Bookmark Message
- Subscribe to Message
- Mute Message
- Subscribe to RSS Feed
- Permalink
- Report Inappropriate Content
Hi @jkat54,
Could you please suggest me on my above question? We can see some data (at-least few data from past 30 days only) not 100% backlog data from past 150 days.
Even if same scenario if lag as 900 seconds & interval as 60 or 300 seconds in all scenario just pulling few days data even if my under-layer OMS/Storage log analytics workspace is having enough back log data for past 150 days. Then why it is not pulling backlogs data 100% but its pulling new future data fine.
My requirement here is at-least i could pull or recovery my all old days data (past 150 days) backlog data 100%.
I am waiting your appreciated help here or please suggest any codes need to update here?
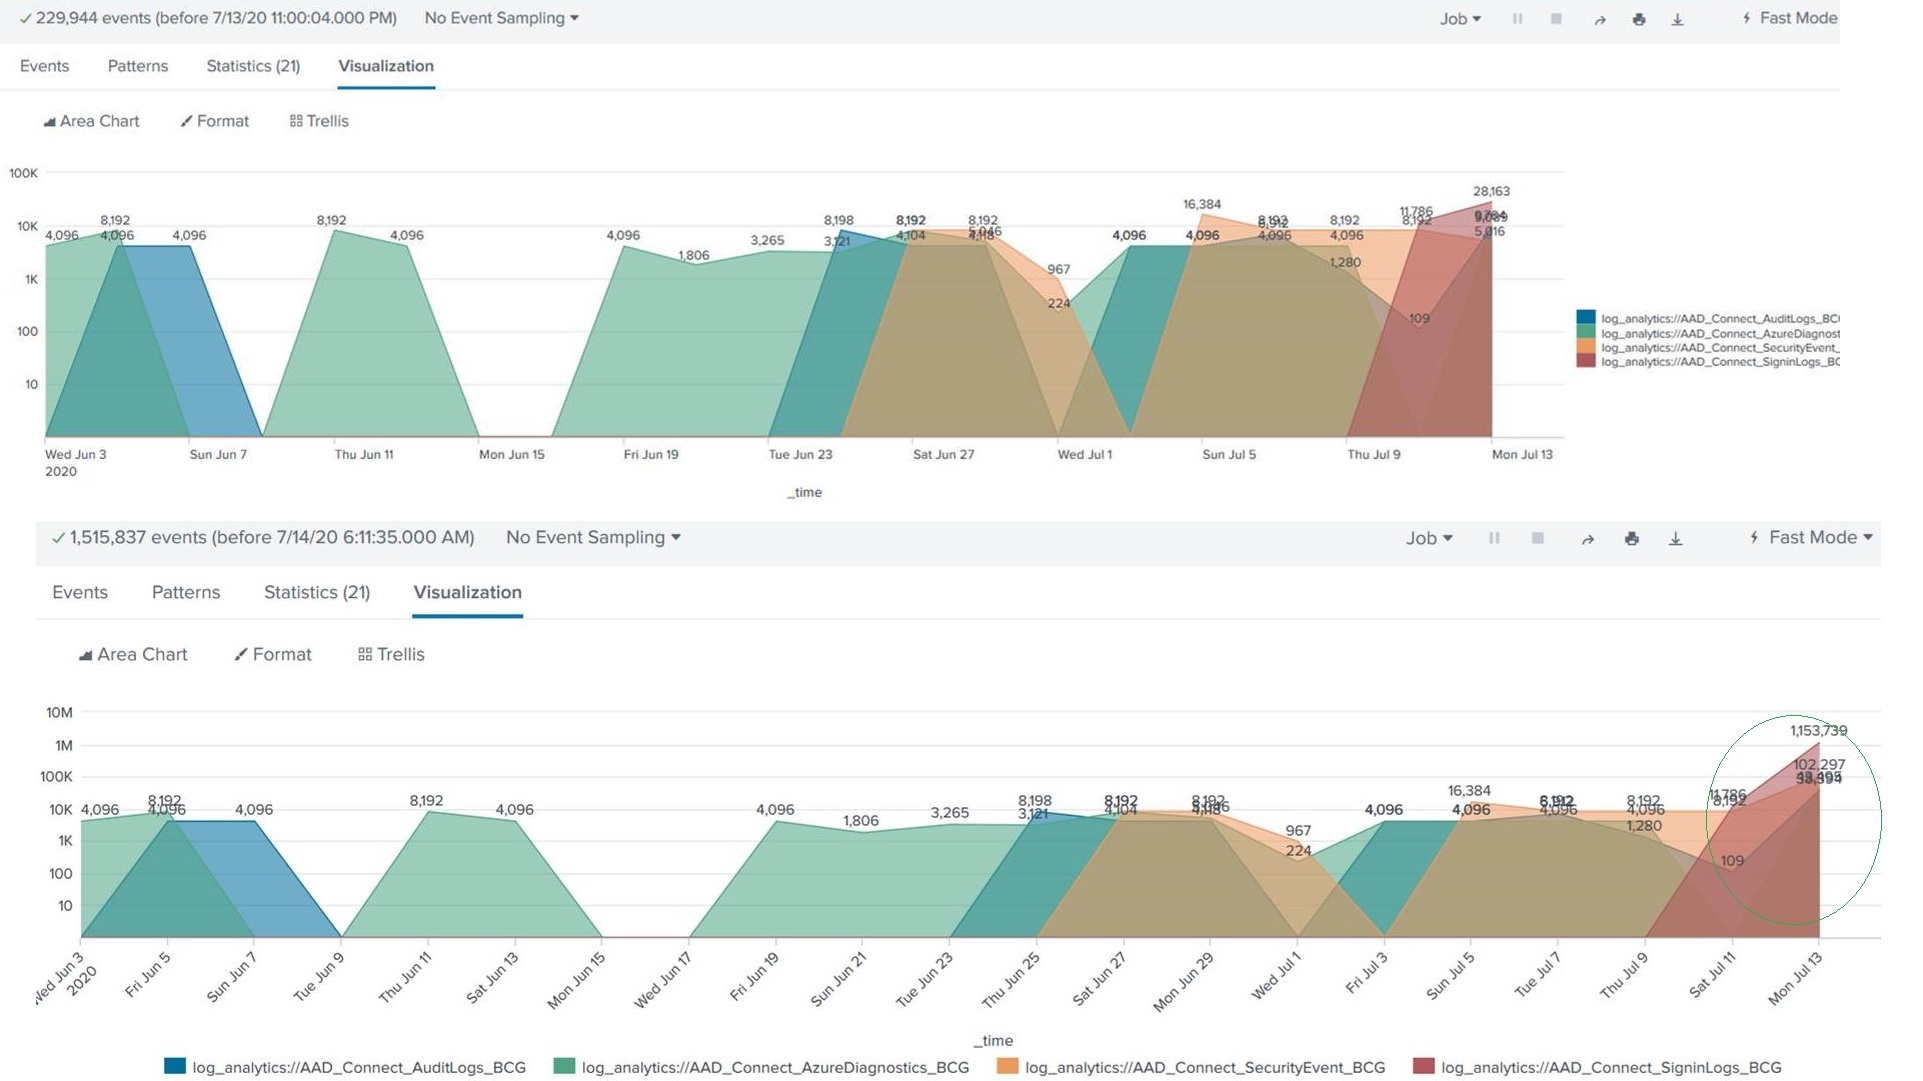
Please see attached graph here & very first graph is yesterday count & second one is today count? Seem to be backlog count is not increases even if storage workspace data are available for past 150 days.
- Mark as New
- Bookmark Message
- Subscribe to Message
- Mute Message
- Subscribe to RSS Feed
- Permalink
- Report Inappropriate Content
Once it has ran one time, it will be updated with new dates and never reach back in time to collect older events.
the solution should be to create a new input with the same config but set start date to 0. You can't just change an existing input to start date 0 because the code only uses that setting on the very first run.
another way to "reset" an existing input to "first run" is to wipe out the kvstore data associated with the input. Just seems easier to create a new input.
- Mark as New
- Bookmark Message
- Subscribe to Message
- Mute Message
- Subscribe to RSS Feed
- Permalink
- Report Inappropriate Content
Thanks ,
Seem to be i am now getting below error like ERRORtime data '0' does not match format '%d/%m/%Y %H:%M:%S' HFR01
2020-07-14 19:25:29.052 message from "python /opt/prd_sec/splunk/etc/apps/TA-ms-loganalytics/bin/log_analytics.py" ERRORtime data '0' does not match format '%d/%m/%Y %H:%M:%S' HFR01
2020-07-14 19:25:29.021 message from "python /opt/prd_sec/splunk/etc/apps/TA-ms-loganalytics/bin/log_analytics.py" ValueError: time data '0' does not match format '%d/%m/%Y %H:%M:%S' HFR01
2020-07-14 19:25:29.021 message from "python /opt/prd_sec/splunk/etc/apps/TA-ms-loganalytics/bin/log_analytics.py" (data_string, format)) HFR01
2020-07-14 19:25:29.021 message from "python /opt/prd_sec/splunk/etc/apps/TA-ms-loganalytics/bin/log_analytics.py" File "/opt/prd_sec/splunk/lib/python2.7/_strptime.py", line 332, in _strptime HFR01
2020-07-14 19:25:29.021 message from "python /opt/prd_sec/splunk/etc/apps/TA-ms-loganalytics/bin/log_analytics.py" start_datetime = datetime.datetime.strptime(str(input_item['start_date']),'%d/%m/%Y %H:%M:%S') HFR01
2020-07-14 19:25:29.021 message from "python /opt/prd_sec/splunk/etc/apps/TA-ms-loganalytics/bin/log_analytics.py" File "/opt/prd_sec/splunk/etc/apps/TA-ms-loganalytics/bin/input_module_log_analytics.py", line 39, in collect_events HFR01
2020-07-14 19:25:29.021 message from "python /opt/prd_sec/splunk/etc/apps/TA-ms-loganalytics/bin/log_analytics.py" input_module.collect_events(self, ew) HFR01
2020-07-14 19:25:29.021 message from "python /opt/prd_sec/splunk/etc/apps/TA-ms-loganalytics/bin/log_analytics.py" File "/opt/prd_sec/splunk/etc/apps/TA-ms-loganalytics/bin/log_analytics.py", line 96, in collect_events HFR01
2020-07-14 19:25:29.021 message from "python /opt/prd_sec/splunk/etc/apps/TA-ms-loganalytics/bin/log_analytics.py" self.collect_events(ew) HFR01
2020-07-14 19:25:29.021 message from "python /opt/prd_sec/splunk/etc/apps/TA-ms-loganalytics/bin/log_analytics.py" File "/opt/prd_sec/splunk/etc/apps/TA-ms-loganalytics/bin/ta_ms_loganalytics/modinput_wrapper/base_modinput.py", line 127, in stream_events HFR01
2020-07-14 19:25:29.021 message from "python /opt/prd_sec/splunk/etc/apps/TA-ms-loganalytics/bin/log_analytics.py" Traceback (most recent call last):
- Mark as New
- Bookmark Message
- Subscribe to Message
- Mute Message
- Subscribe to RSS Feed
- Permalink
- Report Inappropriate Content
Hi @jkat54 , we have done the changes by making the new inputs, and have not changed any parameter in the existing one. so ideally it should work with new inputs having the start_date = <4 month older date>, but it is not. Also the start_date = 0, throws the above error @jhantuSplunk1 comment ref.
- Mark as New
- Bookmark Message
- Subscribe to Message
- Mute Message
- Subscribe to RSS Feed
- Permalink
- Report Inappropriate Content
Hi @jkat54 ,
Just more clarifying on my requirement here that i wanted pull my backlog data from April 9th 2020 to April 14th 2020 but this add-on is not able to get past back logs data.
Could you please help me how could i pull these 7 old days data? Yes, we can see it's pull some back days data one time on very first time run this app but after that it's only pulling current data not back days data.
- Mark as New
- Bookmark Message
- Subscribe to Message
- Mute Message
- Subscribe to RSS Feed
- Permalink
- Report Inappropriate Content
2020-07-15 09:08:43,477 INFO pid=124798 tid=MainThread file=connectionpool.py:_new_conn:758 | Starting new HTTPS connection (1): 127.0.0.1
2020-07-15 09:08:44,494 INFO pid=124798 tid=MainThread file=setup_util.py:log_info:114 | Log level is not set, use default INFO
2020-07-15 09:08:44,494 INFO pid=124798 tid=MainThread file=splunk_rest_client.py:_request_handler:100 | Use HTTP connection pooling
2020-07-15 09:08:44,495 INFO pid=124798 tid=MainThread file=connectionpool.py:_new_conn:758 | Starting new HTTPS connection (1): 127.0.0.1
2020-07-15 09:08:44,504 ERROR pid=124798 tid=MainThread file=base_modinput.py:log_error:307 | Get error when collecting events.
Traceback (most recent call last):
File "/opt/splunk_temp/splunk/etc/apps/TA-ms-loganalytics/bin/ta_ms_loganalytics/modinput_wrapper/base_modinput.py", line 127, in stream_events
self.collect_events(ew)
File "/opt/splunk_temp/splunk/etc/apps/TA-ms-loganalytics/bin/log_analytics.py", line 96, in collect_events
input_module.collect_events(self, ew)
File "/opt/splunk_temp/splunk/etc/apps/TA-ms-loganalytics/bin/input_module_log_analytics.py", line 39, in collect_events
start_datetime = datetime.datetime.strptime(str(input_item['start_date']),'%d/%m/%Y %H:%M:%S')
File "/opt/splunk_temp/splunk/lib/python2.7/_strptime.py", line 332, in _strptime
(data_string, format))
ValueError: time data '0' does not match format '%d/%m/%Y %H:%M:%S'
- Mark as New
- Bookmark Message
- Subscribe to Message
- Mute Message
- Subscribe to RSS Feed
- Permalink
- Report Inappropriate Content
Hi @jkat54 ,
Do you feel anything problem? Why once i used start_date as 0 it's giving ValueError: time data '0' does not match format '%d/%m/%Y %H:%M:%S'. but if i m giving some date it is working to getting current data<=15 mints data but not past 4 months data
props.conf
[azure:loganalytics:ad*]
DATETIME_CONFIG =
INDEXED_EXTRACTIONS = json
NO_BINARY_CHECK = true
TIMESTAMP_FIELDS = XYZ
TIME_FORMAT = %Y-%m-%dT%H:%M:%S.%3N%Z
disabled = false
TZ = Europe/Stockholm
TIME_PREFIX =
category = Structured
KV_MODE =
SHOULD_LINEMERGE = true
inputs.conf
[log_analytics://GFDG_HSE_AD_YYYYYYY]
application_id = TYU
application_key = XXXXXXXXXXXXX
event_delay_lag_time = 900
index = jh_test
sourcetype = azure:loganalytics:ad:AuditLogs
interval = 300
log_analytics_query = ContainerLog | where _ResourceId != ""
resource_group = njjj-gff-oug-gh
start_date = 0
subscription_id = MNO
tenant_id = KPL
workspace_id = HFR
disabled = 0
- Mark as New
- Bookmark Message
- Subscribe to Message
- Mute Message
- Subscribe to RSS Feed
- Permalink
- Report Inappropriate Content
Did you create a NEW input with a different name than before?
sorry 0 didn't work.
- Mark as New
- Bookmark Message
- Subscribe to Message
- Mute Message
- Subscribe to RSS Feed
- Permalink
- Report Inappropriate Content
Yes, we created NEW inputs(NEW STANZA NAME than before).
- Mark as New
- Bookmark Message
- Subscribe to Message
- Mute Message
- Subscribe to RSS Feed
- Permalink
- Report Inappropriate Content
the requirement is to get the missing 7 days data (9th April - 14th April). And when i give start_date even older than my LA retention, it randomly fetches the data for some days, and continue to fetch the current data only(never goes back to pull the old data).
- Mark as New
- Bookmark Message
- Subscribe to Message
- Mute Message
- Subscribe to RSS Feed
- Permalink
- Report Inappropriate Content
have you tried using the API itself to pull the data and see if for some reason the API is limiting the time frame?
- Mark as New
- Bookmark Message
- Subscribe to Message
- Mute Message
- Subscribe to RSS Feed
- Permalink
- Report Inappropriate Content
Yes, we just tried that, we are getting the same count through API itself same as LA workspace count.
- Mark as New
- Bookmark Message
- Subscribe to Message
- Mute Message
- Subscribe to RSS Feed
- Permalink
- Report Inappropriate Content

- Mark as New
- Bookmark Message
- Subscribe to Message
- Mute Message
- Subscribe to RSS Feed
- Permalink
- Report Inappropriate Content
So why not dump the data you pulled from the API to file and ingest?
- Mark as New
- Bookmark Message
- Subscribe to Message
- Mute Message
- Subscribe to RSS Feed
- Permalink
- Report Inappropriate Content
If you can write an api query that works better than my app... you probably should be writing code for my app. You also, don't really need me or my app 😉

Join the Splunk Community Slack to learn, troubleshoot, and make connections with fellow Splunk practitioners in real time!
Join Splunk User Groups to connect and learn in-person by region or remotely by topic or industry.
ATTENTION: We’re Moving! (AGAIN!)
Deep Dive: Optimizing Telemetry Pipelines in Splunk Observability Cloud
Announcing Modern Navigation: A New Era of Splunk User Experience
