
Turn on suggestions
Auto-suggest helps you quickly narrow down your search results by suggesting possible matches as you type.
Getting Data In
×
Join the Conversation
Without signing in, you're just watching from the sidelines. Sign in or Register to connect, share, and be part of the Splunk Community.
- Find Answers
- :
- Splunk Administration
- :
- Getting Data In
- :
- Timestamp extraction failed if no INDEXED_EXTRACTI...
Options
- Subscribe to RSS Feed
- Mark Topic as New
- Mark Topic as Read
- Float this Topic for Current User
- Bookmark Topic
- Subscribe to Topic
- Mute Topic
- Printer Friendly Page
- Mark as New
- Bookmark Message
- Subscribe to Message
- Mute Message
- Subscribe to RSS Feed
- Permalink
- Report Inappropriate Content
Timestamp extraction failed if no INDEXED_EXTRACTION=json on props.conf

emallinger
Communicator
07-08-2021
08:49 AM
Hello,
On a monoinstance Splunk, I'd like to ingest some simple JSON data :
 {
   GDH: 2021-07-08 16:54:00.617222
   action: )reV[viZpy)4noHQFhs7;)*!wHlRaY3mo4R(o6,
   dossier: FR668CORG2021078979348557
   id: 4000000
   ident: 267987
   ip: 10.226.689.32
   org: PN
   service: 3647971
   telephone: +33672108802
}
I'd like to use only KV_mode, without indexed_extractions = json.
Here's my sourcetype :
[data_kvm_json]
DATETIME_CONFIG =
KV_MODE =
LINE_BREAKER = ([\r\n]+)
SHOULD_LINEMERGE = false
TIMESTAMP_FIELDS = GDH
TIME_FORMAT = %Y-%m-%d %H:%M:%S.%6N
category = Structured
description = sourcetype - kv_mode extraction
disabled = false
pulldown_type = true
NO_BINARY_CHECK = true
Here's the result :
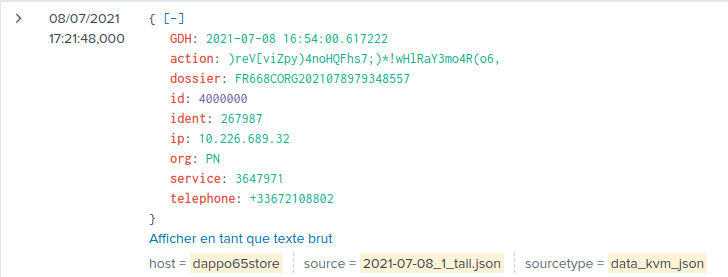
The event is indexed at the time of the ingestion, not the event date wich is is GDH field.
I have several sourcetypes on another environnement (clustered IDX + SH), where this positionned in props.conf on indexer cluster works fine.
Is this a consequence of the architecture being only a mono-instance ?
What did I miss ?
Thanks,
Regards,
Eglantine
- Mark as New
- Bookmark Message
- Subscribe to Message
- Mute Message
- Subscribe to RSS Feed
- Permalink
- Report Inappropriate Content
emallinger
Communicator
07-08-2021
09:06 AM
Hi,
no luck.. same results in the UI (tried with "" and not) :
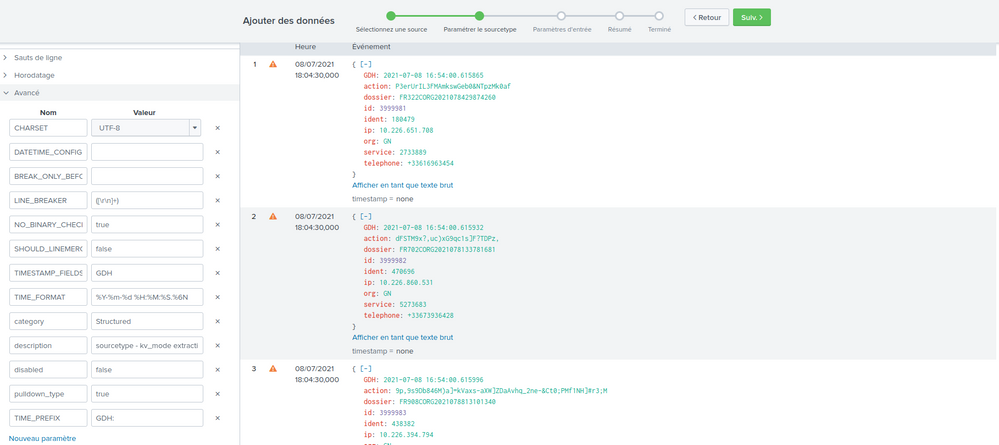
Thanks for the suggestion anyway.
Regards,
Ema
- Mark as New
- Bookmark Message
- Subscribe to Message
- Mute Message
- Subscribe to RSS Feed
- Permalink
- Report Inappropriate Content

richgalloway

SplunkTrust
07-08-2021
08:58 AM
Try adding TIME_PREFIX = GDH: to props.conf
---
If this reply helps you, Karma would be appreciated.
If this reply helps you, Karma would be appreciated.


Got questions? Get answers!
Join the Splunk Community Slack to learn, troubleshoot, and make connections with fellow Splunk practitioners in real time!
Meet up IRL or virtually!
Join Splunk User Groups to connect and learn in-person by region or remotely by topic or industry.
Get Updates on the Splunk Community!
Announcing Modern Navigation: A New Era of Splunk User Experience
We are excited to introduce the Modern Navigation feature in the Splunk Platform, available to both cloud and ...
Analytics Workspace removal in Splunk 10.6
In Splunk Cloud Platform and Splunk Enterprise 10.6, Analytics Workspace is removed from product and no longer ...
Vibe-coding, AI, and Splunkcraft: Highlights from the .conf26 Builder Bar
If you stopped by the Builder Bar at .conf26, thank you! This year, we brought ...
