- Splunk Answers
- :
- Splunk Administration
- :
- Getting Data In
- :
- Re: Parsing DNS logs sent from EpiLog agent
- Subscribe to RSS Feed
- Mark Topic as New
- Mark Topic as Read
- Float this Topic for Current User
- Bookmark Topic
- Subscribe to Topic
- Mute Topic
- Printer Friendly Page
- Mark as New
- Bookmark Message
- Subscribe to Message
- Mute Message
- Subscribe to RSS Feed
- Permalink
- Report Inappropriate Content
Parsing DNS logs sent from EpiLog agent
Our DNS logs are sent via syslog to a HF through an Epilog agent. The EpiLog agent reads the dns log file line by line and each line is sent as a separate event to the HF, looking something like this:
Dec 24 04:05:11 192.####### MSDNSLog 0 12/24/2021 12:02:06 AM 04B4 PACKET 000000####### UDP Rcv 142.####### 3f94 R Q [8281 DR SERVFAIL] PTR (2)87in-addr(4)arpa(0)
Dec 24 04:05:11 192.####### MSDNSLog 0 UDP response info at 000000EE456861F0
Dec 24 04:05:11 192.####### MSDNSLog 0 Socket = 1244
Dec 24 04:05:11 192.####### MSDNSLog 0 Remote addr 142.1#######, port 53
Dec 24 04:05:11 192.#######MSDNSLog 0 Time Query=1220313, Queued=0, Expire=0
Dec 24 04:05:11 192.####### MSDNSLog 0 Buf length = 0x0fa0 (4000)
Dec 24 04:05:11 192.####### MSDNSLog 0 Msg length = 0x0037 (55)
Dec 24 04:05:11 192.####### MSDNSLog 0 Message:
Dec 24 04:05:11 192.####### MSDNSLog 0 XID 0x3f94
Dec 24 04:05:11 192.####### MSDNSLog 0 Flags 0x8182
Dec 24 04:05:11 192.####### MSDNSLog 0 QR 1 (RESPONSE)
Dec 24 04:05:11 192.####### MSDNSLog 0 OPCODE 0 (QUERY)
Dec 24 04:05:11 192.####### MSDNSLog 0 AA 0
Dec 24 04:05:11 192.####### MSDNSLog 0 TC 0
Dec 24 04:05:11 192.####### MSDNSLog 0 RD 1
Dec 24 04:05:11 192.####### MSDNSLog 0 RA 1
Dec 24 04:05:11 192.####### MSDNSLog 0 Z 0
Dec 24 04:05:11 192.####### MSDNSLog 0 CD 0
Dec 24 04:05:11 192.####### MSDNSLog 0 AD 0
Dec 24 04:05:11 192.#######MSDNSLog 0 RCODE 2 (SERVFAIL)
Dec 24 04:05:11 192.####### MSDNSLog 0 QCOUNT 1
Dec 24 04:05:11 192.1####### MSDNSLog 0 ACOUNT 0
Dec 24 04:05:11 192.####### MSDNSLog 0 NSCOUNT 0
Dec 24 04:05:11 192.1###### MSDNSLog 0 ARCOUNT 1
Dec 24 04:05:11 192.1##### MSDNSLog 0 QUESTION SECTION:
Dec 24 04:05:11 192.1##### MSDNSLog 0 Offset = 0x000c, RR count = 0
So originally each of those lines was indexed as a separate event in Splunk. I played around with the props.conf file for that specific sourcetype and set the parameters as follows:
SHOULD_LINEMERGE=TRUE
TIME_PREFIX to match Dec 24 04:05:11 192.###### MSDNSLog 0
TIME_FORMAT=%m/%d/%Y %l:%M:%S %p
BREAK_ONLY_BEFORE=PACKET (Every event starts with a line that contains packet)
LINE_BREAKER = ([\r\n]+)
TRUNCATE=0
MAX_EVENTS=500000 (I've seen some events be very long)
MAX_TIMESTAMP_LOOKAHEAD=100
SEDCMD-null = regex to get rid of Dec 24 04:05:11 192.####### MSDNSLog 0 at the beginning of every line
Based on my understanding (and I played around with Add Data on a searchhead and the above parameters, where it works), the following should happen: The lines are broken on each new line, then they are merged, with each new event being formed when a line has PACKET in it, timestamp is extracted and then the MSDNSLOG stuff at the beginning of each line is removed.
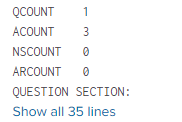
However, I'm not seeing the timestamp being extracted properly and some (not all)of the DNS events get split like below into separate events:
What could I be missing to get all events merged correctly? Please keep in mind that using sysmon/network tap/stream is not an option at the moment so I stuck with trying to the data ingested properly using the conf files.
- Mark as New
- Bookmark Message
- Subscribe to Message
- Mute Message
- Subscribe to RSS Feed
- Permalink
- Report Inappropriate Content
@tscroggins I tried the above and but it made the events splitting worse. The best performance I've gotten so far is with the corrected time format like you posted and your suggested TIME_PREFIX, but otherwise the parameters in the stanza being the same as in my original post.
- Mark as New
- Bookmark Message
- Subscribe to Message
- Mute Message
- Subscribe to RSS Feed
- Permalink
- Report Inappropriate Content
Rather than using line merging, let's disable line merging and configure line breaking directly:
# replace with your source, source type, etc.
[source::udp:514]
SHOULD_LINEMERGE = false
LINE_BREAKER = ([\r\n])+\w{3} \d{2} \d{2}:\d{2}:\d{2} \d{1,3}\.\d{1,3}\.\d{1,3}\.\d{1,3} MSDNSLog 0 \d{2}\/\d{2}\/\d{4} \d{2}:\d{2}:\d{2} (A|P)M
# trailing space after 0!
TIME_PREFIX = MSDNSLog 0
MAX_TIMESTAMP_LOOKAHEAD = 23
TIME_FORMAT = %m/%d/%Y %I:%M:%S %p
#TZ = <time zone>
This is a "best practice," although actual best practices depend on context.
The LINE_BREAKER value matches all lines with timestamps and IPv4 addresses containing the timestamp you want to extract. This the beginning of the event. The next time the regular expression matches, a new event will be created. All lines between the matches will be added to the current event.
Note the trailing space after the 0 in TIME_PREFIX.
I've assumed a 12-hour clock from your example. Be sure to set the TZ value (see https://en.wikipedia.org/wiki/List_of_tz_database_time_zones) if the event time zone differs from the time zone of your Splunk instance.


