Join the Conversation
- Find Answers
- :
- Splunk Administration
- :
- Getting Data In
- :
- Re: Monitoring services and process and which port...
- Subscribe to RSS Feed
- Mark Topic as New
- Mark Topic as Read
- Float this Topic for Current User
- Bookmark Topic
- Subscribe to Topic
- Mute Topic
- Printer Friendly Page
- Mark as New
- Bookmark Message
- Subscribe to Message
- Mute Message
- Subscribe to RSS Feed
- Permalink
- Report Inappropriate Content
HI.
I know how to monitoring process and services in Windows, but I don't know how to see port which use process/service.
All logs that I have right now and including process/services not have any fields with ports.
For example, I wanna make one table which will include service/process and port. How can I realize it?
- Mark as New
- Bookmark Message
- Subscribe to Message
- Mute Message
- Subscribe to RSS Feed
- Permalink
- Report Inappropriate Content
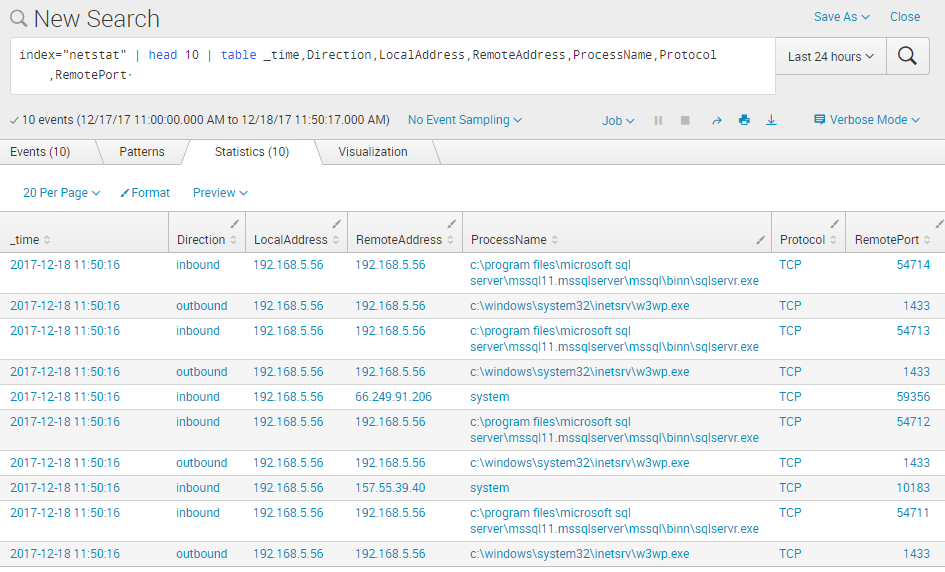
On Splunk Windows 64-bit installations you can configure a Splunk network monitoring data input to collect this type of information:
This will collect quite a lot of details about each TCP/IP connection on that system. Here is a sample list:
- Mark as New
- Bookmark Message
- Subscribe to Message
- Mute Message
- Subscribe to RSS Feed
- Permalink
- Report Inappropriate Content
- Mark as New
- Bookmark Message
- Subscribe to Message
- Mute Message
- Subscribe to RSS Feed
- Permalink
- Report Inappropriate Content
This looks great but I don't see an input-type, "Splunk network monitoring" when I try to add it to my Splunk Enterprise 7.3 environment. Is that a particular add-on or app?
- Mark as New
- Bookmark Message
- Subscribe to Message
- Mute Message
- Subscribe to RSS Feed
- Permalink
- Report Inappropriate Content
Splunk Add-on for Microsoft Windows
https://splunkbase.splunk.com/app/742/
Jacob
If you feel this response answered your question, please do not forget to mark it as such. If it did not, but you do have the answer, feel free to answer your own post and accept that as the answer.
- Mark as New
- Bookmark Message
- Subscribe to Message
- Mute Message
- Subscribe to RSS Feed
- Permalink
- Report Inappropriate Content
Preempting your reply.
If your universal forwarders are *nix based, the splunk_TA_nix TAcomes with an input called openPortsEnhanced.sh which you can enable.
Add the following to your inputs.conf in the TA.
[script://./bin/openPortsEnhanced.sh]
disabled = false
It will yield results as follows:
Mon Dec 18 16:43:54 GMT 2017 app=splunkd dest_ip=* dest_port=8089 pid=34624 user=splunk fd=5u ip_version=4 dvc_id=46637453 transport=TCP
Mon Dec 18 16:43:54 GMT 2017 app=splunkd dest_ip=* dest_port=8000 pid=34624 user=splunk fd=53u ip_version=4 dvc_id=46655525 transport=TCP
Mon Dec 18 16:43:54 GMT 2017 app=mongod dest_ip=* dest_port=8191 pid=36671 user=splunk fd=5u ip_version=4 dvc_id=46645516 transport=TCP
Mon Dec 18 16:43:54 GMT 2017 app=python dest_ip=127.0.0.1 dest_port=8065 pid=36831 user=splunk fd=15u ip_version=4 dvc_id=46655518 transport=TCP
- Mark as New
- Bookmark Message
- Subscribe to Message
- Mute Message
- Subscribe to RSS Feed
- Permalink
- Report Inappropriate Content
Thank you for answer!
- Mark as New
- Bookmark Message
- Subscribe to Message
- Mute Message
- Subscribe to RSS Feed
- Permalink
- Report Inappropriate Content
Is this on a universal forwarder - and which OS?


