- Find Answers
- :
- Splunk Administration
- :
- Getting Data In
- :
- Re: JSON is one huge single entry - Is there a way...
- Subscribe to RSS Feed
- Mark Topic as New
- Mark Topic as Read
- Float this Topic for Current User
- Bookmark Topic
- Subscribe to Topic
- Mute Topic
- Printer Friendly Page
- Mark as New
- Bookmark Message
- Subscribe to Message
- Mute Message
- Subscribe to RSS Feed
- Permalink
- Report Inappropriate Content
Hello. We just installed the REST API Modular Input App into Splunk in order to capture Dynatrace logs from the Dynatrace SaaS environment. The output format from Dynatrace is in JSON. It works good as the Dynatrace data is coming right into Splunk.
The problem is I can not seem to figure out how I can split it apart inside Splunk.
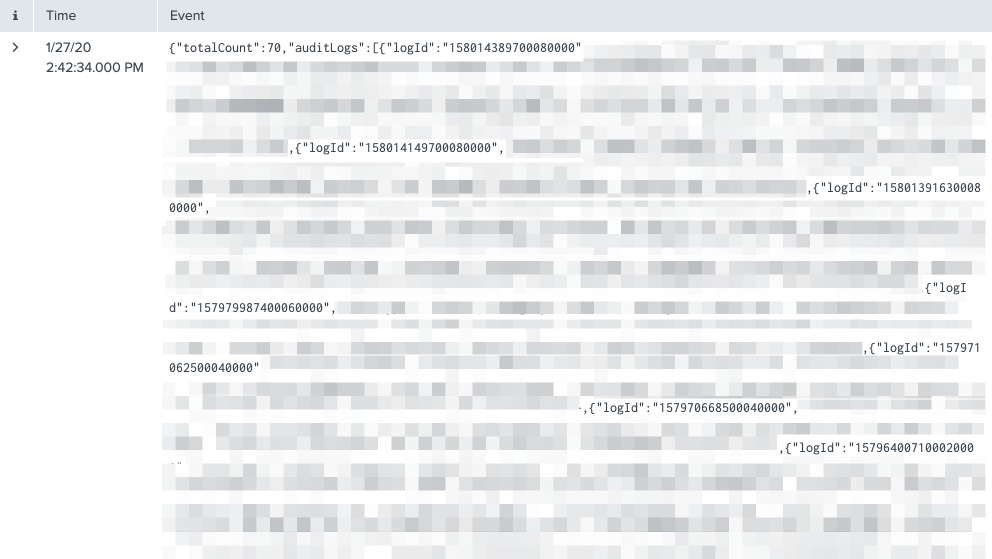
For example, each line item in Splunk should be based on the Dynatrace “logId” rather than one huge single line entry. As you can from the start of the JSON output from Dynatrace, there is actually 70 log entries in this JSON. Each one should be its own entry in Splunk.
Does anyone know if there is something I can do via the REST API Modular Input App configuration (Data Input configuration) that would tell it to split this JSON by the “logId”? If not, is there a way I could tell Splunk to do it?
As you can see, every single log entry is all listed as one huge line item in Splunk.
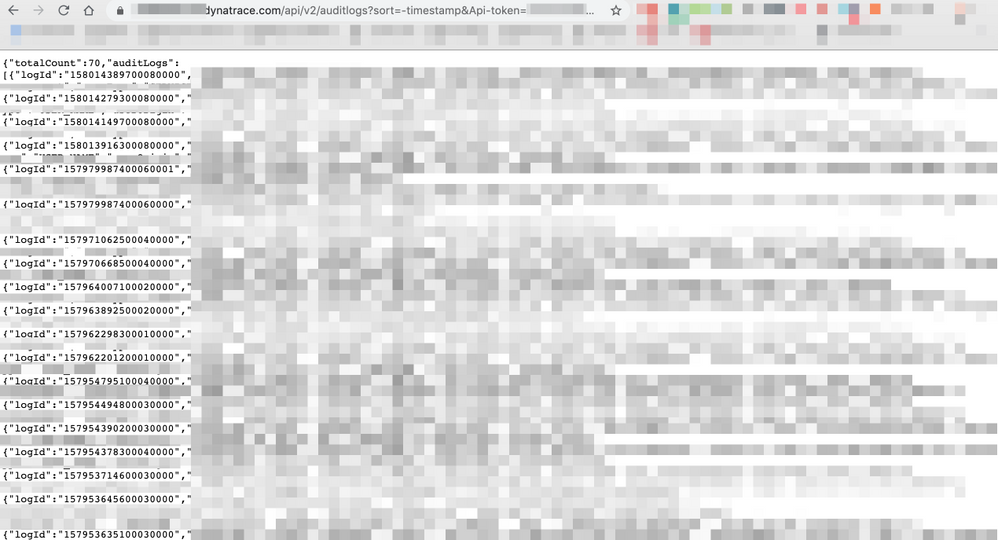
Here is what the returned JSON looks like directly in Google Chrome.
Thank you
- Mark as New
- Bookmark Message
- Subscribe to Message
- Mute Message
- Subscribe to RSS Feed
- Permalink
- Report Inappropriate Content
70lines is OK, mvexpand OR stats list
your search
| spath path=auditLogs{} output=auditLogs
| stats values(_time) as _time by auditLogs
After this, let`s extract fields.
If you are lucky,
your search
| spath path=auditLogs{} output=auditLogs
| stats values(_time) as _time by auditLogs
| spath input=auditLogs
That's all.
- Mark as New
- Bookmark Message
- Subscribe to Message
- Mute Message
- Subscribe to RSS Feed
- Permalink
- Report Inappropriate Content
That did the trick! So much better. Thank you!
I was hoping there was a way I could do it through configuration, but if through search is the only way, that works too. Very much appreciated.
- Mark as New
- Bookmark Message
- Subscribe to Message
- Mute Message
- Subscribe to RSS Feed
- Permalink
- Report Inappropriate Content
wow, you are lucky.
Thanks and happy Splunking.
- Mark as New
- Bookmark Message
- Subscribe to Message
- Mute Message
- Subscribe to RSS Feed
- Permalink
- Report Inappropriate Content
Approach 1) Have u tried combination of spath and mv expand. Something like spath path=auditLogs{} output=x | fields - _raw | fields x| mvexpand x
Approach 2) Try delimiting by logId and then assign value to field and apply mvexpand on top of it


