
Join the Conversation
- Find Answers
- :
- Splunk Administration
- :
- Getting Data In
- :
- Re: How to split single sourcetype in multiple one...
- Subscribe to RSS Feed
- Mark Topic as New
- Mark Topic as Read
- Float this Topic for Current User
- Bookmark Topic
- Subscribe to Topic
- Mute Topic
- Printer Friendly Page
- Mark as New
- Bookmark Message
- Subscribe to Message
- Mute Message
- Subscribe to RSS Feed
- Permalink
- Report Inappropriate Content
How to split single sourcetype in multiple ones based on json field value?

Hi all,
recently my customer asked me to integrate different JSON log sources (VPN concentrator, WAF and Load Balancers) comeing from only one Azure event hub. I onboarded it using the Splunk Add-on for Microsoft Cloud Services (https://splunkbase.splunk.com/app/3110) from the Inputs Data Manager Instance (IDM) and I selected the deafult sourcetype "mscs:azure:eventhub". At this point I need to split this sourcetype in three new ones, one for each log type (VPN concentrator, WAF and Load Balancers) distinguishing them and creating custom field extractions and so on for the Data Models. I found a field "category" within the JSON logs which can be used as splitting criteria:
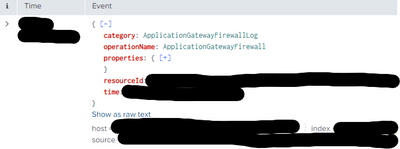
Have you any idea to do that?
Thanks in advance!
- Mark as New
- Bookmark Message
- Subscribe to Message
- Mute Message
- Subscribe to RSS Feed
- Permalink
- Report Inappropriate Content


You cannot rename the source type for data that has already been indexed. You can do some things at search time, but since that is inefficient I won't go into it. Your best bet is likely sending the data feed to a heavy forwarder, setting the source types appropriately (inputs, props, transforms), and then kicking it to the indexers.
- Mark as New
- Bookmark Message
- Subscribe to Message
- Mute Message
- Subscribe to RSS Feed
- Permalink
- Report Inappropriate Content
Hi @Atriarc ,
my idea was to configure such a parser, maybe in the indxer before indexing.


Join the Splunk Community Slack to learn, troubleshoot, and make connections with fellow Splunk practitioners in real time!
Join Splunk User Groups to connect and learn in-person by region or remotely by topic or industry.
Cisco Data Fabric from Architecture to Investigation, Better SOC Visibility, and More ...
The Trust Gap: Why a Data Foundation is Fundamental to an Agentic Enterprise
Data Management Digest – September 2026
