Are you a member of the Splunk Community?
- Find Answers
- :
- Splunk Administration
- :
- Getting Data In
- :
- How to push the Japanese language in winevent log ...
- Subscribe to RSS Feed
- Mark Topic as New
- Mark Topic as Read
- Float this Topic for Current User
- Bookmark Topic
- Subscribe to Topic
- Mute Topic
- Printer Friendly Page
- Mark as New
- Bookmark Message
- Subscribe to Message
- Mute Message
- Subscribe to RSS Feed
- Permalink
- Report Inappropriate Content
How to push the Japanese language in winevent log monitoring?
Hello all,
I have a Japanese language windows server from which I am testing to push the data to Tier1 index.
However, although the language settings in the server is Japanese, all the data is pushed as English. Adding the inputs and props file that is configured as below on the UF in windows server.
Please let me know how do I do this.
inputs.conf:
###### OS Logs ######
[WinEventLog://Application]
disabled = 0
start_from = oldest
current_only = 0
checkpointInterval = 5
# only index events with these event IDs.
whitelist = 0-2000,2001-10000
index = acn_infra360-wineventlog_default_tier1_idx
_TCP_ROUTING = winevent_dev1
renderXml=false

[WinEventLog://Security]
disabled = 0
start_from = oldest
current_only = 0
checkpointInterval = 5
# only index events with these event IDs.
whitelist = 0-2000,2001-10000
index = acn_infra360-wineventlog_default_tier1_idx
_TCP_ROUTING = winevent_dev1
renderXml=false
Props.conf:
[WinEventLog://Application]
description = Windows Event Monitoring
CHARSET = SHIFT-JIS
BREAK_ONLY_BEFORE = \d{2}/\d{2}/\d{4} \d{2}:\d{2}:\d{2}
TIME_FORMAT = %m-%d-%Y %T
sourcetype = WinEventLog:Application

[WinEventLog://Security]
description = Windows Event Monitoring
CHARSET = SHIFT-JIS
BREAK_ONLY_BEFORE = \d{2}/\d{2}/\d{4} \d{2}:\d{2}:\d{2}
TIME_FORMAT = %m-%d-%Y %T
sourcetype = WinEventLog:Security
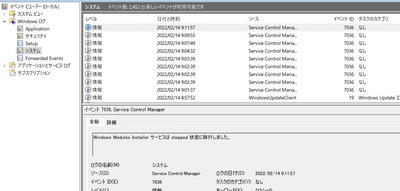
Also, attaching the screenshot of the event viewer from the server.
- Mark as New
- Bookmark Message
- Subscribe to Message
- Mute Message
- Subscribe to RSS Feed
- Permalink
- Report Inappropriate Content
The events are pulled from Event Log as they are in the log.
If you click the details tab in the event and switch to XML view, you'll see what the raw event really looks like in the log.
The view in the opening view is already rendered by appropriate DLL for this kind of log.
Often there is no string representation of the event at all in the event itself. Sometimes some entities reported in the event will have english names. Sometimes they will be in proper local language. It varies.
For example. This event:
<Event xmlns="http://schemas.microsoft.com/win/2004/08/events/event">
 <System>
  <Provider Name="SecurityCenter" />
  <EventID Qualifiers="0">15</EventID>
  <Version>0</Version>
  <Level>4</Level>
  <Task>0</Task>
  <Opcode>0</Opcode>
  <Keywords>0x80000000000000</Keywords>
  <TimeCreated SystemTime="2022-02-14T12:38:42.7480016Z" />
  <EventRecordID>39855</EventRecordID>
  <Correlation />
  <Execution ProcessID="0" ThreadID="0" />
  <Channel>Application</Channel>
  <Computer>mylaptop</Computer>
  <Security />
 </System>
 <EventData>
  <Data>Windows Defender</Data>
  <Data>SECURITY_PRODUCT_STATE_ON</Data>
 </EventData>
</Event>
Will be shown in event log on my polish-language windows laptop as
Even though there is no such string as "Pomyslnie zaktualizowano" in the event itself.
- Mark as New
- Bookmark Message
- Subscribe to Message
- Mute Message
- Subscribe to RSS Feed
- Permalink
- Report Inappropriate Content
Yes, got it. It is same here too.
Is there another way to add the Japanese language so this is being pushed to the index?
- Mark as New
- Bookmark Message
- Subscribe to Message
- Mute Message
- Subscribe to RSS Feed
- Permalink
- Report Inappropriate Content
There is no such information in the event itself so just by pulling raw events from event log - no. You could manually define a calculated field in splunk but that would require quite a lot of work and would obviously only covet the cases known beforehand.
Maybe, but I'm not an expert on windows here so it's a great "maybe" you could pull rendered events using custom script or program but then you'd get the data in format not conforming to that which Add-on for windows expects.
It's simply that when working with windows events you usually search for event codes (regardless of whether you use splunk or any other tool).


