- Find Answers
- :
- Splunk Administration
- :
- Getting Data In
- :
- How to monitor multiple data pipelines?
- Subscribe to RSS Feed
- Mark Topic as New
- Mark Topic as Read
- Float this Topic for Current User
- Bookmark Topic
- Subscribe to Topic
- Mute Topic
- Printer Friendly Page
- Mark as New
- Bookmark Message
- Subscribe to Message
- Mute Message
- Subscribe to RSS Feed
- Permalink
- Report Inappropriate Content
I'm planning to introduce index parallelization into our Splunk deployment given the additional resources we have on our indexers. In looking at the DMC, specifically under Indexing Performance, I don't see that it accounts for multiple data pipelines running in parallel. What is the best way to monitor multiple data pipelines running on one indexer.
- Mark as New
- Bookmark Message
- Subscribe to Message
- Mute Message
- Subscribe to RSS Feed
- Permalink
- Report Inappropriate Content
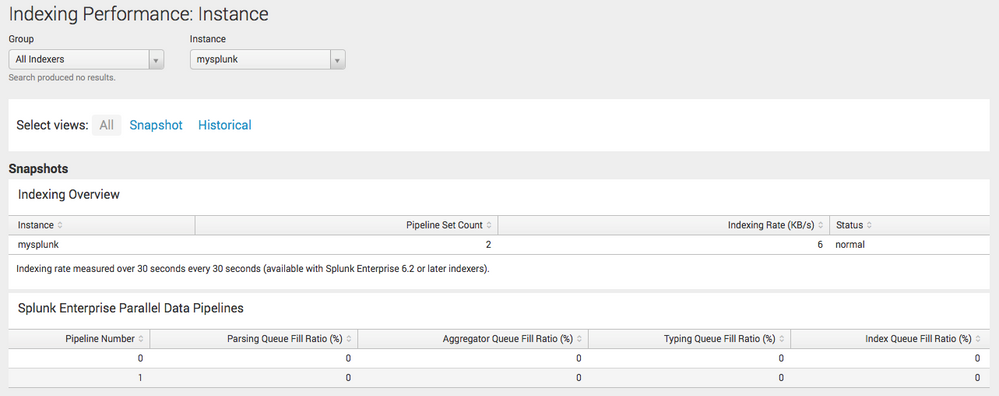
You need the DMC - Indexing Performance - Instance. It will show the pipelines for that instance, and you can then select individual ones.
- Mark as New
- Bookmark Message
- Subscribe to Message
- Mute Message
- Subscribe to RSS Feed
- Permalink
- Report Inappropriate Content
This also works: | rest splunk_server= ENTER HOST /services/server/introspection/queues
- Mark as New
- Bookmark Message
- Subscribe to Message
- Mute Message
- Subscribe to RSS Feed
- Permalink
- Report Inappropriate Content
- Mark as New
- Bookmark Message
- Subscribe to Message
- Mute Message
- Subscribe to RSS Feed
- Permalink
- Report Inappropriate Content
Thanks for the comment. I do not see that when there are two or three Data Pipelines running in parallel.
"the pipelinesets setting in server.conf. When pipeline sets are used (that is, if pipelinesets is set to a value greater than 1), some panels in the DMC indexing performance dashboards will be blank." Is there a work around?
- Mark as New
- Bookmark Message
- Subscribe to Message
- Mute Message
- Subscribe to RSS Feed
- Permalink
- Report Inappropriate Content
@a212830 is right, you can see it there. I just uploaded a screenshot where you can see the Parallel Data Pipelines. Did you check they are enabled and do you run DMC on the correct instance? This was take running a stand alone instance.
cheers, MuS
- Mark as New
- Bookmark Message
- Subscribe to Message
- Mute Message
- Subscribe to RSS Feed
- Permalink
- Report Inappropriate Content
Thanks @MuS
- Mark as New
- Bookmark Message
- Subscribe to Message
- Mute Message
- Subscribe to RSS Feed
- Permalink
- Report Inappropriate Content
It's the version. Looks like Parallel Data Pipelines are shown on the DMC for version 6.4.X. We are running version 6.3.2.

