Are you a member of the Splunk Community?
- Find Answers
- :
- Splunk Administration
- :
- Getting Data In
- :
- Re: How to format json event data so that it can b...
- Subscribe to RSS Feed
- Mark Topic as New
- Mark Topic as Read
- Float this Topic for Current User
- Bookmark Topic
- Subscribe to Topic
- Mute Topic
- Printer Friendly Page
- Mark as New
- Bookmark Message
- Subscribe to Message
- Mute Message
- Subscribe to RSS Feed
- Permalink
- Report Inappropriate Content
Hi Team,
I am new here and would like to find a way to tackle this problem. I have structured json events that I am able to push to http event collector and create dashboards. However, if I save the same json event data to a logfile and use the forwarder then Splunk is unable to extract the fields.
My sample json event is below.
{"time":1668673601179,
"host":"SAG-13X8573",
"event":
{"correlationid":"11223361",
"name":"API Start",
"apiName":"StatementsAPI",
"apiOperation":"getStatements",
"method":"GET",
"requestHeaders":
{"Accept":"application/json",
"Content-Type":"application/json"},
"pathParams":
{"customerID":"11223344"},
"esbReqHeaders":
{"Accept":"application/json"}
}
}
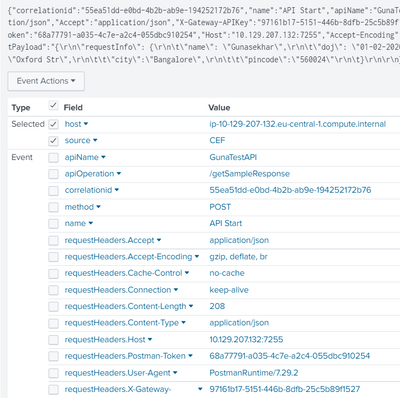
if I post this to http event collector I am able to see the fields correctly like below.
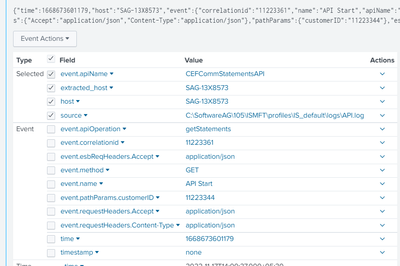
If I save the same json data to a log file and forwarder sends this data to Splunk, it couldn't parse the data properly. All I see is like below.
The event fields are not extracted properly including the timestamp.
Should I format the json data in any other way before writing it to log file? Or any other configurations need to be done to make it work? Pls let me know. Thank you
- Mark as New
- Bookmark Message
- Subscribe to Message
- Mute Message
- Subscribe to RSS Feed
- Permalink
- Report Inappropriate Content
Hello,
I think only the content of "event" in your example should be written in a file for a forwarder input monitor.
"time" and "host" are metadata that can be used in HEC entry but are not strictly necessary in files.
The host value in file monitor will be either the default hostname of the forwarder or the one you set in the monitor stanza for this particular file.
I have both entry types, and I can confirm the format is different.
In file : JSONL with only the content of your "event" example
In HEC entry points : same format as yours with a bunch of metadata, like sourcetype for the indexer to be able to correctly index the data source.
So you should make SURE that there is a timestamp/date field IN the event (and not outside of if as per your example).
Try it and post the results ?
Regards,
Ema
- Mark as New
- Bookmark Message
- Subscribe to Message
- Mute Message
- Subscribe to RSS Feed
- Permalink
- Report Inappropriate Content
Not sure I follow you :
- in the file, in each event if the field name is "host" it should be available just fine, no ?
OR
- you need to put it in your inputs.conf with the monitor stanza => as an option "host = ..." if it is the same one for all the data in the file.
Otherwise, I would suggest adding an alias between host and extracted host for your sourcetype.
What do you think ?
- Mark as New
- Bookmark Message
- Subscribe to Message
- Mute Message
- Subscribe to RSS Feed
- Permalink
- Report Inappropriate Content
Hi Ema,
If the host is part of event data then it's only showing it as 'extracted_host' and original host name (of log file) is picked up as 'host' parameter. The use case is that transaction flow happens across multiple applications. So all applications emit these events and some will be routed to through a queuing mechanism before written to a central log file and some will be pushed through HEC. So it's a must that we extract this hostname from event for tracking purpose.
I will read about this alias creation and try.
- Mark as New
- Bookmark Message
- Subscribe to Message
- Mute Message
- Subscribe to RSS Feed
- Permalink
- Report Inappropriate Content
Ok, I understand.
That means it got improved in the version you are using !
Because in the past, I had some data sources where host, source and other splunk default fields had been used and it got all merged. unfortunately, the data didn't meant the same thing, so it was a problem.
In that case, I think the alias is your best bet.
- Mark as New
- Bookmark Message
- Subscribe to Message
- Mute Message
- Subscribe to RSS Feed
- Permalink
- Report Inappropriate Content
Hi again, @gut1kor
Found another way to set host per event with props.conf and TRANSFORMS :
[sourcetype_name]
TRANSFORMS-register=name
[name]
SOURCE_KEY=_raw
REGEX = server:(\w+) # capturing regex adated to your data
DEST_KEY = MetaData:Host
FORMAT = host::$1
Need to be tested.
Regards,
Ema
- Mark as New
- Bookmark Message
- Subscribe to Message
- Mute Message
- Subscribe to RSS Feed
- Permalink
- Report Inappropriate Content
Hi Ema, thank you very much, I really appreciate your help. I will try this and let you know.
- Mark as New
- Bookmark Message
- Subscribe to Message
- Mute Message
- Subscribe to RSS Feed
- Permalink
- Report Inappropriate Content
@emallinger thank you very much, as you said I have moved the date and host fields to event part and wrote the json to log file and now Splunk could extract timestamp and other fields as usual. For host in event data it's showing extracted_host. I guess if I don't find any solution to make Splunk use this parameter as actual host for the event, I probably need to tweak my dashboard query; something like if extracted_host exists in the event then I will use it's value otherwise default host value.
- Mark as New
- Bookmark Message
- Subscribe to Message
- Mute Message
- Subscribe to RSS Feed
- Permalink
- Report Inappropriate Content
Hi Ema,
thank you very much. I will try this and post the results.
If we want the hostname as well in the event data, is it possible to make Splunk use it?
- Mark as New
- Bookmark Message
- Subscribe to Message
- Mute Message
- Subscribe to RSS Feed
- Permalink
- Report Inappropriate Content
Hello,
I think only the content of "event" in your example should be written in a file for a forwarder input monitor.
"time" and "host" are metadata that can be used in HEC entry but are not strictly necessary in files.
The host value in file monitor will be either the default hostname of the forwarder or the one you set in the monitor stanza for this particular file.
I have both entry types, and I can confirm the format is different.
In file : JSONL with only the content of your "event" example
In HEC entry points : same format as yours with a bunch of metadata, like sourcetype for the indexer to be able to correctly index the data source.
So you should make SURE that there is a timestamp/date field IN the event (and not outside of if as per your example).
Try it and post the results ?
Regards,
Ema


