Join the Conversation
- Find Answers
- :
- Splunk Administration
- :
- Getting Data In
- :
- How to check the total usage percentage by Windows...
- Subscribe to RSS Feed
- Mark Topic as New
- Mark Topic as Read
- Float this Topic for Current User
- Bookmark Topic
- Subscribe to Topic
- Mute Topic
- Printer Friendly Page
- Mark as New
- Bookmark Message
- Subscribe to Message
- Mute Message
- Subscribe to RSS Feed
- Permalink
- Report Inappropriate Content
Hi all,
How do you check the total % of memory being used by a windows server.
Which Performance counter can help us find the total Percentage of memory a windows server is consuming?
Thanks,
Om
- Mark as New
- Bookmark Message
- Subscribe to Message
- Mute Message
- Subscribe to RSS Feed
- Permalink
- Report Inappropriate Content
- Mark as New
- Bookmark Message
- Subscribe to Message
- Mute Message
- Subscribe to RSS Feed
- Permalink
- Report Inappropriate Content
- Mark as New
- Bookmark Message
- Subscribe to Message
- Mute Message
- Subscribe to RSS Feed
- Permalink
- Report Inappropriate Content
% Committed Bytes In Use
- Mark as New
- Bookmark Message
- Subscribe to Message
- Mute Message
- Subscribe to RSS Feed
- Permalink
- Report Inappropriate Content
Thank you for the reply.
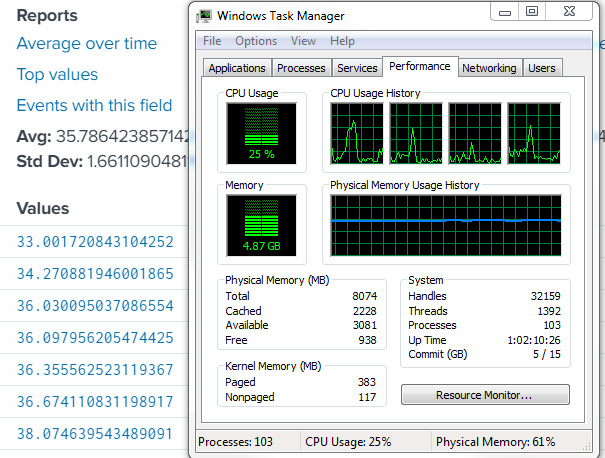
I tried to match the Memory usage in the Performance tab in the Windows task manager to the % Committed Bytes in Use. But the % committed bytes in use is lower than the values showed in the Task Manager. is there any other counter's value that has to be added to the % committed bytes in use.
Thank you
- Mark as New
- Bookmark Message
- Subscribe to Message
- Mute Message
- Subscribe to RSS Feed
- Permalink
- Report Inappropriate Content
But the two numbers should not be far apart though.
% Committed Bytes In Use is virtual memory used against "Commit Limit", which could be higher than physical memory -- this is for performance reasons so clean pages don't get ejected due to committed size ~= Physical Limit.
To make your life easier, if you see % Committed Bytes In Use is near 80%, then you are hitting memory limit -- only two ways to resolve this: add more memory (so Commit Limit will also increase) and run less load.
Better approach is to capture both
% Committed Bytes In Use
Available Bytes
If % Committed Bytes In Use is > 80%, OR Available Bytes is < 5%, your system is under extreme memory stress.
Thanks.
- Mark as New
- Bookmark Message
- Subscribe to Message
- Mute Message
- Subscribe to RSS Feed
- Permalink
- Report Inappropriate Content
Yes, but how do we calculate % of Available bytes. Counter gives only numbers in Bytes or KBytes or MBytes. Where can I get the total memory installed on system to calculate the total % in use.
- Mark as New
- Bookmark Message
- Subscribe to Message
- Mute Message
- Subscribe to RSS Feed
- Permalink
- Report Inappropriate Content
The stanza should be present in Splunk_TA_windows . Install this addon onto your Search Head for field extractions
But essentially, Create an app YOUR_windows_inputs and put below stanza into inputs.conf and push it to your clients (using deployment server)
## Memory
[perfmon://Memory]
counters = Page Faults/sec; Available Bytes; Committed Bytes; Commit Limit; Write Copies/sec; Transition Faults/sec; Cache Faults/sec; Demand Zero Faults/sec; Pages/sec; Pages Input/sec; Page Reads/sec; Pages Output/sec; Pool Paged Bytes; Pool Nonpaged Bytes; Page Writes/sec; Pool Paged Allocs; Pool Nonpaged Allocs; Free System Page Table Entries; Cache Bytes; Cache Bytes Peak; Pool Paged Resident Bytes; System Code Total Bytes; System Code Resident Bytes; System Driver Total Bytes; System Driver Resident Bytes; System Cache Resident Bytes; % Committed Bytes In Use; Available KBytes; Available MBytes; Transition Pages RePurposed/sec; Free & Zero Page List Bytes; Modified Page List Bytes; Standby Cache Reserve Bytes; Standby Cache Normal Priority Bytes; Standby Cache Core Bytes; Long-Term Average Standby Cache Lifetime (s)
disabled = false
interval = 30
object = Memory
useEnglishOnly=true
index = yourWindowsIndex
This should report to yourWindowsIndex with relevant sourcetype.
Good to have a read on: https://docs.splunk.com/Documentation/Splunk/latest/Data/MonitorWindowsperformance
- Mark as New
- Bookmark Message
- Subscribe to Message
- Mute Message
- Subscribe to RSS Feed
- Permalink
- Report Inappropriate Content

