Join the Conversation
- Find Answers
- :
- Splunk Administration
- :
- Getting Data In
- :
- Re: How to add data from universal forwarder into ...
- Subscribe to RSS Feed
- Mark Topic as New
- Mark Topic as Read
- Float this Topic for Current User
- Bookmark Topic
- Subscribe to Topic
- Mute Topic
- Printer Friendly Page
- Mark as New
- Bookmark Message
- Subscribe to Message
- Mute Message
- Subscribe to RSS Feed
- Permalink
- Report Inappropriate Content
How to add data from universal forwarder into splunk.
I have attached screenshots of my search screen and universal forwarder monitoring screen.
I can find them in the forwarder monitoring screen but not in the search screen.
I followed the steps from below link.
http://docs.splunk.com/Documentation/SplunkLight/7.0.3/GettingStarted/GettingdataintoSplunkLightusin...
I could do till step 5, but not step 6.
The New button is not available in search screen.
- Mark as New
- Bookmark Message
- Subscribe to Message
- Mute Message
- Subscribe to RSS Feed
- Permalink
- Report Inappropriate Content
- Mark as New
- Bookmark Message
- Subscribe to Message
- Mute Message
- Subscribe to RSS Feed
- Permalink
- Report Inappropriate Content
Hi ajindal,
I confirmed Splunk Light is working correctly when adding and configuring a universal forwarder. I just went through the entire process as documented in the link I gave you, using Splunk Light 7.0.3, and Splunk Universal Forwarder 7.0.3. Make sure that your forwarder is compatible with your Splunk Light version.
To help you, I did some troubleshooting when I had issues getting a connection, so I uninstalled the forwarder and was very careful re-installing, making sure to:
- Set the receiving port in the user interface to 9997 (TCP). This can be found at Data > Data receiving in the left sidebar menu.
- Added the forward-server command. For example: ./splunk add forward-server IPaddress:9997 -auth admin:changeme
- Added the deploy-poll command. For example ./splunk set deploy-poll IPaddress:8089. Note you are giving the management port number for Splunk Light here.
- Performed a restart, for example ./splunk restart
Note:
-- After installing Splunk Light, the installation files are found in the Splunk directory, with splunk in the bin directory. Management port is typically 8089.
-- After installing the Splunk Universal Forwarder, the installation files are found in the SplunkForwarder directory, with splunk in the bin directory. The management port has to be different than Splunk Light's management port of 8089 or there is a conflict, so I set the universal forwarder's management port to 8090.
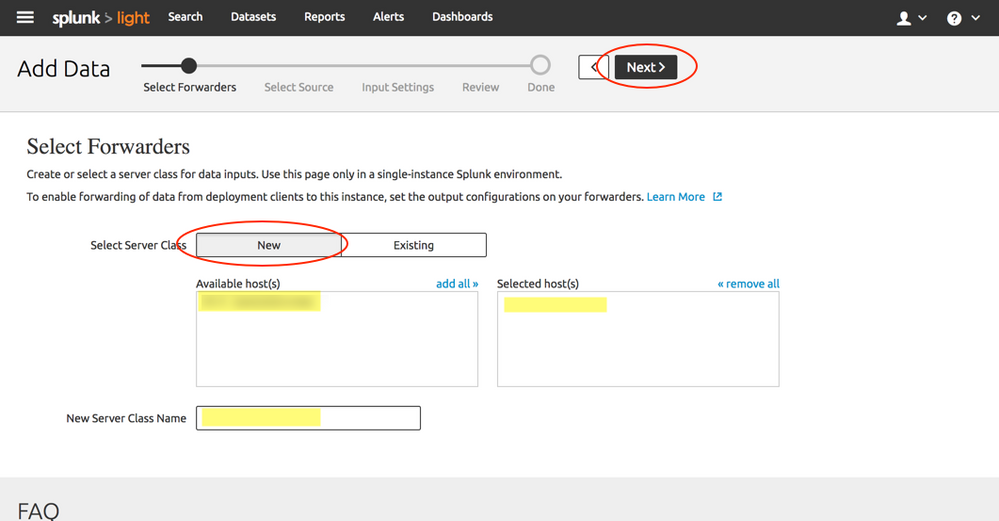
After the universal forwarder is installed and you perform a restart, the forwarder takes a few minutes to load. You should be able to see the forwarder on the Forwarder management screen after the restart. You can now add data. Click the Search tab > Add Data > Forward. You should see the attached add_data_universalforwarder screen. Select a new or existing Server Class from the Available hosts (host name) and add a Server Class Name if new > Click Next near the top of the screen to go to the next step.
To see the dashboard on the Forwarder monitoring screen, you must go to System > Forwarder monitoring in the sidebar menu and on the Forwarder monitoring screen click the box for Enable Forwarder Montoring. It does take a few minutes to load. See my attached monitoring-screen-uf screenshot of the Forwarder monitoring screen.
I suggest you confirm that you have the ports, IP address and commands correctly installed, and with no port conflicts.
Hope this helps. 
- Mark as New
- Bookmark Message
- Subscribe to Message
- Mute Message
- Subscribe to RSS Feed
- Permalink
- Report Inappropriate Content
Are your forwarders showing up on the Forwarder Monitoring screen, and the Forwarder Management screen?
If they are, you should then be able to be able to click the Search tab and be on the Search screen > click the Add Data button (under the Data section on the right of the Search screen) > On the Add Data screen, click the Forward circle/button > and then on the next Add Data screen, see Select Server Class and click New. You should then see your Available hosts listed with hostnames of your available universal forwarders.
If you are not seeing your forwarders on the Forwarder Monitoring screen and the Forwarder Management screen, then there might be a forwarder configuration issue.
- Mark as New
- Bookmark Message
- Subscribe to Message
- Mute Message
- Subscribe to RSS Feed
- Permalink
- Report Inappropriate Content
I'm testing it now to make sure what I'm telling you is correct.
- Mark as New
- Bookmark Message
- Subscribe to Message
- Mute Message
- Subscribe to RSS Feed
- Permalink
- Report Inappropriate Content
Whats your Splunk deployment looks like? Do you have single instance deployment (single server acting as Search Head, Indexer, deployment server) OR distributed deployment?
- Mark as New
- Bookmark Message
- Subscribe to Message
- Mute Message
- Subscribe to RSS Feed
- Permalink
- Report Inappropriate Content
Splunk Light should be single instance deployment. If a distributed deployment is the goal, then upgrade to Enteprise.


