Are you a member of the Splunk Community?
- Find Answers
- :
- Splunk Administration
- :
- Getting Data In
- :
- HF having "Ingestion Latency" & "Large and Archive...
- Subscribe to RSS Feed
- Mark Topic as New
- Mark Topic as Read
- Float this Topic for Current User
- Bookmark Topic
- Subscribe to Topic
- Mute Topic
- Printer Friendly Page
- Mark as New
- Bookmark Message
- Subscribe to Message
- Mute Message
- Subscribe to RSS Feed
- Permalink
- Report Inappropriate Content
HF having "Ingestion Latency" & "Large and Archive File Reader" & "Real-time Reader" issues
Hi Splunkers,
I'm trying to troubleshoot an issue with Splunk that I'm facing:
I have a Splunk heavy forwarder setting on the customer side, through it the customer sends the logs of the Splunk universal forwarders and the network devices (switches, routers, and firewalls), and this HF sends the logs to 2 indexers (on my side) through a VPN.
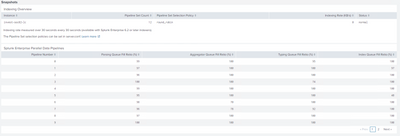
I have noticed that the HF is having the pipelines are 100% full!
I have tried to increase the number of pipelines but with no luck.
I checked the "list monitor" command in Splunk:
/opt/splunk/bin/splunk list monitor | wc -l
and it results with 690
I then modified the "limits.conf" on the HF:
[inputproc]
max_fd = 900
restarted Splunk but still nothing is fixed
In the customer environment, there are about 15 firewalls, they are configured to send syslog logs to a Splunk heavy forwarder that has syslog-ng installed on it.
Recently I have noticed that the logs from the firewalls when I query them on the SH they are delayed!
Even though the syslog logs from the firewalls themselves are being received in real-time on the heavy forwarder!
I have run the following command using CLI to check if there is any blockage and as expected there are a lot of them:
grep blocked=true /opt/splunk/var/log/splunk/metrics.log*
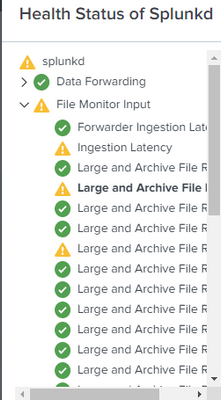
And in the GUI, in the "Health Status of Splunkd":
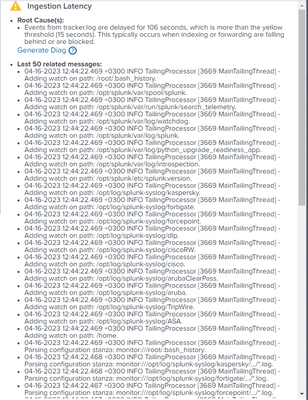
under the "Ingestion Latency":
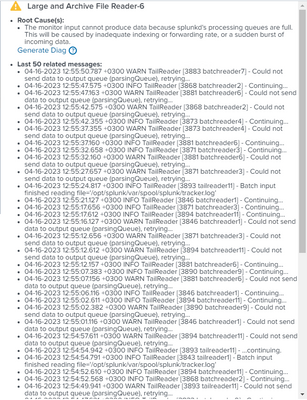
And under the "Large and Archive File Reader":
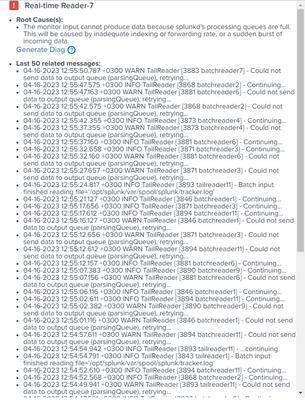
And under the "Real-time Reader":
what is the issue that I'm facing?
I'm running Splunk 9.0.4 on the HF
CPU: 12
RAM: 16
- Mark as New
- Bookmark Message
- Subscribe to Message
- Mute Message
- Subscribe to RSS Feed
- Permalink
- Report Inappropriate Content
There are MANY reasons for this including:
See "maxKBps = <integer>" section here:
http://docs.splunk.com/Documentation/Splunk/latest/Admin/Limitsconf
If you are using "monitor", you MUST clean up old files because the scanning breaks down SEVERELY once you have 200 or so files co-resident, even if you are NOT monitoring them! You can switch to "batch" which deletes the files once read.
- Mark as New
- Bookmark Message
- Subscribe to Message
- Mute Message
- Subscribe to RSS Feed
- Permalink
- Report Inappropriate Content
Sorry, but you are simply wrong here. Yes, too many monitored files can cause performance issues but at a way way higher threshold. I've seen environments with several thousands files in monitored directories working well. If the files are on a remote storage - that can cause delays, especially on a forwarder start. But it's more an underlying OS issue than Splunk as such.
And "advice" to switch from monitor to batch is... well, unwise. Try ingesting a growing file (as in syslogd output file) by batch input. Good luck.
- Mark as New
- Bookmark Message
- Subscribe to Message
- Mute Message
- Subscribe to RSS Feed
- Permalink
- Report Inappropriate Content
It is not reasonable to say that something that I have seen, I actually did not see. I did not say that it ALWAYS happens, I said that at hundreds I have seen it happen. At thousands it almost always happens.
- Mark as New
- Bookmark Message
- Subscribe to Message
- Mute Message
- Subscribe to RSS Feed
- Permalink
- Report Inappropriate Content
It's hard to say without seeing the full picture. But generally, single indexing pipeline utilizes 4-6 cores which means that if you have 4 parallel indexing pipelines you're oversubscribed. And that doesn't include inputs.
What is your throughput on this HF?
- Mark as New
- Bookmark Message
- Subscribe to Message
- Mute Message
- Subscribe to RSS Feed
- Permalink
- Report Inappropriate Content
@PickleRick
On the HF, under the limits.conf:
[thruput]
maxKBps = 0
[inputproc]
max_fd = 900
and under the outputs.conf:
[tcpout]
defaultGroup = primary_indexers
maxQueueSize = 100MB
useACK = false
forceTimebasedAutoLB = true
autoLBFrequency= 30
autoLBVolume = 15728640
indexAndForward = false
forwardedindex.filter.disable = true
compressed = false
forwardedindex.2.whitelist = (_audit|_introspection|_internal)
[tcpout:primary_indexers]
server = x.x.x.10:9997, x.x.x.11:9997
[indexAndForward]
index = false
Please note that even though I have increased the number of "parallelIngestionPipelines" to 12, the server specs were not impacted! nothing is fully saturated as I expected it to do! the CPU utilization is 2% and the RAM is 7 GB out of 16 GB!
- Mark as New
- Bookmark Message
- Subscribe to Message
- Mute Message
- Subscribe to RSS Feed
- Permalink
- Report Inappropriate Content
Looks pretty OK (maybe with some LB settings which could use some tweaking).
What kind of network connection do you have between this HF and your indexers? Because if your indexers choked on your data, you should get warnings about throtting but if the network connection itself is getting saturated, you could get something like this
Another point is if you have a low-bandwidth connection, using HF for ingesting data at this point is a bad idea since HF parses data and sends parsed data to downstream whereas UF would send cooked data which by average is about 1/6th of the volume of parsed data.
- Mark as New
- Bookmark Message
- Subscribe to Message
- Mute Message
- Subscribe to RSS Feed
- Permalink
- Report Inappropriate Content
The network connection between this HF and the two indexers is a VPN site-to-site connection, as this HF is on the customer site and the two indexers are on our site.
Regarding your second point, we are using HFs in this case because:
- The UFs are on the customer side and the indexers are on our site, we can't just simply send all the UF data directly to the indexers, we needed an HF in the middle.
- We installed syslog-ng on the HF to collect the syslog logs from the network devices (firewalls, routers, switches, etc.) that are on the customer side, then we created a local inputs.conf on the HF and in it a monitor stanza to monitor the syslog logs directory and send them to the indexers.
- We also installed and configured the db connect app on the HF to get the database logs from the customer also.
What I have done lately is adding another new HF alongside this one hoping somehow to eliminate the issues, then I configured all the UFs to send the logs only to the new HF, leaving the old HF to handle only the syslog logs and the databases, yet the issue with the old HF is still there!
Isn't having the below prevent the HF from parsing the logs?
[indexAndForward]
index = false
- Mark as New
- Bookmark Message
- Subscribe to Message
- Mute Message
- Subscribe to RSS Feed
- Permalink
- Report Inappropriate Content
No. The "index=false" entry means only that _after parsing the data isn't written localy to index files but sent further downstream for indexing. As parsed data.
You can use UF as an intermediate forwarder.
You can use UF to monitor syslog-ng log files.
The only thing that really needs a HF is indeed the dbconnect app.
But you could use HF for dbconnect and UF for the rest. In case of low-bandwidth link it could be highly benefitial considering amount of traffic produced.
Anyway, check your VPN tunnel bandwidth and usage.
