Are you a member of the Splunk Community?
- Find Answers
- :
- Splunk Administration
- :
- Getting Data In
- :
- Can you help me with my search results visualizati...
- Subscribe to RSS Feed
- Mark Topic as New
- Mark Topic as Read
- Float this Topic for Current User
- Bookmark Topic
- Subscribe to Topic
- Mute Topic
- Printer Friendly Page
- Mark as New
- Bookmark Message
- Subscribe to Message
- Mute Message
- Subscribe to RSS Feed
- Permalink
- Report Inappropriate Content
The original data is json format
Search Language is as follows:
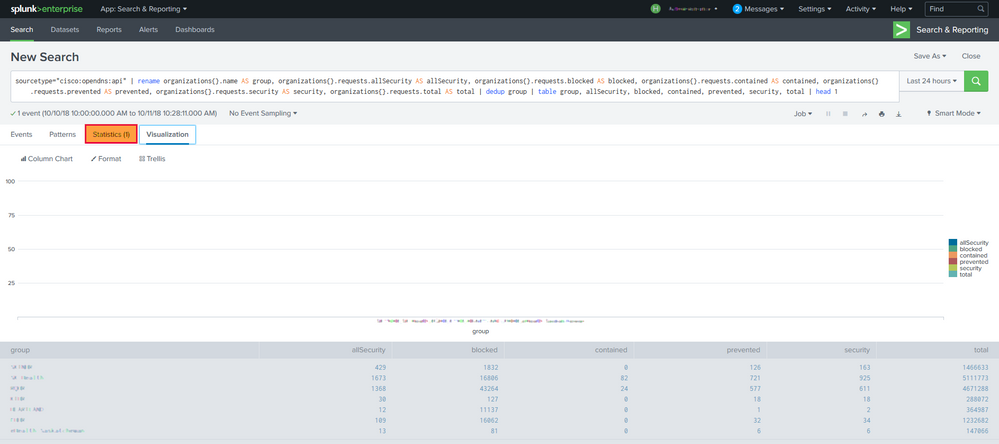
I successfully extracted the data and displayed as a table. But why did the visualization fail? I just want for each "group" to have a bar stacked. Seems that the issue is with the "Statistics": (1), How do I split it into 7 lines?
> sourcetype="cisco:opendns:api" |
> rename organizations{}.name AS group,
> organizations{}.requests.allSecurity
> AS allSecurity,
> organizations{}.requests.blocked AS
> blocked,
> organizations{}.requests.contained AS
> contained,
> organizations{}.requests.prevented AS
> prevented,
> organizations{}.requests.security AS
> security,
> organizations{}.requests.total AS
> total | table group, allSecurity,
> blocked, contained, prevented,
> security, total | head 1
- Mark as New
- Bookmark Message
- Subscribe to Message
- Mute Message
- Subscribe to RSS Feed
- Permalink
- Report Inappropriate Content
I'm guessing the charting fails due to multivalued fields you've in your event (there are multiple groups in a single event, the numerical values are treated as string in multivalued field and thus can't be plotted). You'd need expand them into single value fields/row and then plot. Give this a try
sourcetype="cisco:opendns:api"
|  rename organizations{}.name AS group,  organizations{}.requests.*  AS *
| table group, allSecurity,  blocked, contained, prevented,  security, total | head 1
| eval temp=mvzip(mvzip(mvzip(mvzip(mvzip(mvzip(group,allSecurity,"#"), blocked,"#"),contained,"#"),prevented,"#"),security,"#"),total,"#")
| table temp
| mvexpand temp
| rex field=temp "(?<group>[^#]+)#(?<allSecurity>[^#]+)#(?<blocked>[^#]+)#(?<contained>[^#]+)#(?<prevented>[^#]+)#(?<security>[^#]+)#(?<total>[^#]+)"
| fields -temp
- Mark as New
- Bookmark Message
- Subscribe to Message
- Mute Message
- Subscribe to RSS Feed
- Permalink
- Report Inappropriate Content
Thanks somesoni2. It works, but why it's so complicated!
following is the final search language:
sourcetype="cisco:opendns:api" |
rename organizations{}.name AS group,
organizations{}.requests.allSecurity
AS allSecurity,
organizations{}.requests.blocked AS
blocked,
organizations{}.requests.contained AS
contained,
organizations{}.requests.prevented AS
prevented,
organizations{}.requests.security AS
security,
organizations{}.requests.total AS
total | table group, allSecurity,
blocked, contained, prevented,
security, total | head 1 | eval
temp=mvzip(mvzip(mvzip(mvzip(mvzip(mvzip(group,allSecurity,"#"),
blocked,"#"),contained,"#"),prevented,"#"),security,"#"),total,"#")
| table temp | mvexpand temp | rex
field=temp
"(?[^#]+)#(?[^#]+)#(?[^#]+)#(?[^#]+)#(?[^#]+)#(?[^#]+)#(?[^#]+)" | fields group, allSecurity, blocked,
contained, prevented, security
- Mark as New
- Bookmark Message
- Subscribe to Message
- Mute Message
- Subscribe to RSS Feed
- Permalink
- Report Inappropriate Content
It's because of how your data is logged. Ideally all data points (a unique combination of fields group, allSecurity, blocked, contained, prevented, security) should be available as separate set, e.g. in individual rows. That way you'd be able to plot them better. Since you've json array with your data, we need additional code to split them into separate rows.
- Mark as New
- Bookmark Message
- Subscribe to Message
- Mute Message
- Subscribe to RSS Feed
- Permalink
- Report Inappropriate Content
You are correct! I reviewed my other data also in json-format but not as json-array, only use "rename" can makes it work fine. Seems I need spend more time on json and splunk extract data. Thanks again!


