Good afternoon from France !
I'm sorry to boring you, but I need your help.
Since this morning, I started the installation of Splunk on Linux RedHat.
I successed for read the logs from the physical machine (where Splunk is installed), for read the logs from a remote machine with Splunk forwarder (where my Docker is). And now, I try to read and receive the container's logs from Docker in the interface web Splunk, but doesn't work.
So, step by step :
1) First, I create my Token in Splunk, activate it, and I restart Splunk :
(Sorry, french screen-shot)
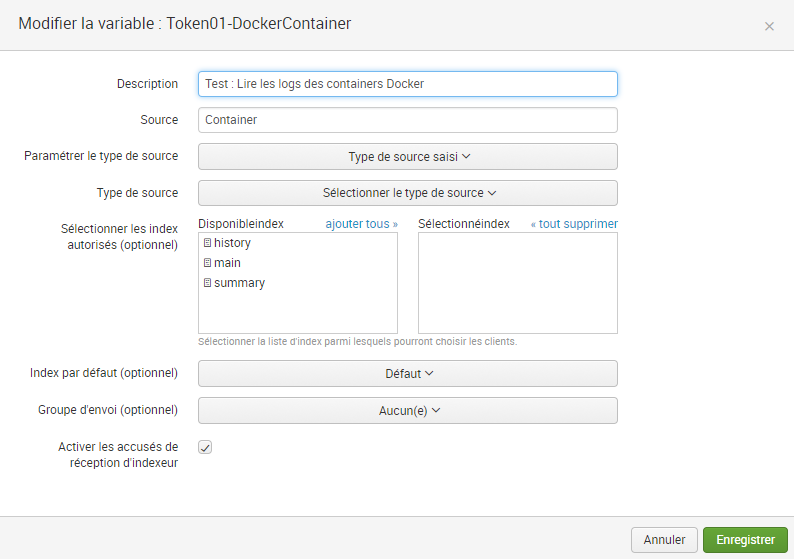
![
2) After that, on my Docker machine, I edited the deamon.json and restart Docker :
{
"log-driver": "splunk",
"log-opts": {
"splunk-token": "blabla",
"splunk-url": "http://152.34.65.33:8000",
"splunk-verify-connection": "true",
"splunk-format": "json"
}
}
When I execute "docker info", I can assure that the log driver is interpreted.
I run a Nginx container and I generate logs with CURL.
BUT, unlike the tutorials I followed, nothing happend in my Web Interface. I don't know how to debug, see some trace.
So if you see any particular error in this code or in my logic, please !
Thank's a lot,
Regards.
@splunkTest13 splunk logging author here
I would suggest you at first try to enable Splunk Logging Driver on the container level, so just when you deploy your first container use the
docker run --log-driver=splunk --log-opt splunk-token=VALUE --log-opt splunk-url=VALUE
Make sure that you can get it to work and after that try to change the default logging driver, see https://docs.docker.com/engine/admin/logging/splunk/#usage for details.
Before trying the logging driver I would suggest to actually try to send something to HTTP Event Collector using just simple curl command
curl -k https://hec.example.com:8088/services/collector/event/1.0 -H "Authorization: Splunk TOKEN" -d '{"event": "hello world"}'
{"text": "Success", "code": 0}
Make sure to put the right scheme (http, https), domain, port (you can see what is set in global HTTP Event Collector configuration). If that works now you just need to take the right https://hec.example.com:8088
and use it for your container logs.
If you still want to go with the route of using Splunk Logging Driver as a default logging driver and you want to modify daemon configuration. You can look inside the syslog/journald logs to see the logs from the daemon logs, use journalctl
(see https://access.redhat.com/documentation/en-us/red_hat_enterprise_linux/7/html/system_administrators_...) or try to tail /var/log/messages
if you use rsyslog (depending on how it is setup).
As an alternative I would suggest you to look on alternative solutions, which our company provides for monitoring Docker and getting logs and metrics in Splunk. You can find our certified application on https://splunkbase.splunk.com/app/3723/, instructions on how to get started https://www.outcoldsolutions.com/docs/monitoring-docker/ and our comparison with Splunk Logging Driver https://www.outcoldsolutions.com/docs/collectorfordocker/#comparing-with-splunk-logging-driver
Hello outcoldman
i have tried your above suggested options but no o still same issue i am facing . i have a local splunk set up on my machine and i am able to curl and send the data. i can also see the logs in splunk.
but when i do below command i get errors and it will not run it says connection refused.
docker run --log-driver=splunk \
--log-opt splunk-url=http://localhost:8088/ \
--log-opt splunk-token=token \
--log-opt splunk-insecureskipverify=true \
hello-world
i have another splunk cloud whihc is org one and i have a token for HEC as well when i run the above command it runs but i do not see any logs not sure why .
if i am able to make it work on local thaat will be great and then later i can figure out why its not able to work on cloud
Hi,
Thank's, I can see this error yesterday. But even if I change the port from my daemon.json in :
{
"log-driver": "splunk",
"log-opts": {
"splunk-token": "blabla",
"splunk-url": "http://152.34.65.33:**8088**"
}
}
I don't receine any data.
When I am in the web interface splunk, in server, general settings, there is :
Management port : 8089
Web port : 8000
Server applications port : 8065
So, I try to change in my daemon.json the port in :
{
"log-driver": "splunk",
"log-opts": {
"splunk-token": "blabla",
"splunk-url": "http://152.34.65.33:**8089**"
}
}
Still nothing in Splunk !
But thanks for answer
Have you tried using https as it is the default protocol?
Please try again using
splunk-url": "https://152.34.65.33:8088"
and let me know if that solved the issue.
The HTTP Event Collector receives data over HTTPS on TCP port 8088 by default.
Your Splunk-url indicates port 8000. That may well be the problem!