Join the Conversation
- Find Answers
- :
- Splunk Administration
- :
- Getting Data In
- :
- Re: Adding additional column after grouping for JS...
- Subscribe to RSS Feed
- Mark Topic as New
- Mark Topic as Read
- Float this Topic for Current User
- Bookmark Topic
- Subscribe to Topic
- Mute Topic
- Printer Friendly Page
- Mark as New
- Bookmark Message
- Subscribe to Message
- Mute Message
- Subscribe to RSS Feed
- Permalink
- Report Inappropriate Content
The incoming logs are stored in Splunk in a JSON format.
Example JSON records below.
Entry 1 :
{   data:[
    {
      "endpoint":"ep_1",
      "service":"service_1",
      "http_status_code":"500"
    },
    {
      "endpoint":"ep_2",
      "service":"service_1",
      "http_status_code":"500"
    },
    {
      "endpoint":"ep_3",
      "service":"service_2",
      "http_status_code":"503"
    }   ] }
Entry 2 :
{
  data:[
    {
      "endpoint":"ep_1",
      "service":"service_1",
      "http_status_code":"500"
    }
  ]
}
The expected output for my search should be something like :
When I search using the query:
host=mashery_production "data{}.http_status_code"= 5*| eval endpoint='data{}.endpoint' | eval service='data{}.service' | Stats Count("data{}.status") as Count, values(service), by endpoint | where Error_Count > 0
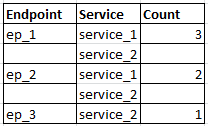
the output I get is :
which looks like the grouping is messed up. Please help.
- Mark as New
- Bookmark Message
- Subscribe to Message
- Mute Message
- Subscribe to RSS Feed
- Permalink
- Report Inappropriate Content
HI technie101
Can you please try below search??
host=mashery_production "data{}.http_status_code"= inactive
| rename data{}.endpoint as endpoint, data{}.service as service, data{}.status as status
| eval tempField=mvzip(mvzip(endpoint,service),status)
| stats count by _time,tempField
| eval endpoint=mvindex(split(tempField,","),0), service=mvindex(split(tempField,","),1), status=mvindex(split(tempField,","),1)
| search status="inactive"
| stats count by endpoint,service
Thanks
- Mark as New
- Bookmark Message
- Subscribe to Message
- Mute Message
- Subscribe to RSS Feed
- Permalink
- Report Inappropriate Content
Hi Kamlesh,
I had wrongly typed the json response which was not matching with the search query that I gave. Apologies. I've updated it now.
Coming to this suggestion, I've tried with the below and I don't see any results.
host=mashery_production "data{}.http_status_code"= 5*
 | rename data{}.endpoint_name as endpoint, data{}.service_name as service, data{}.http_status_code as status
 | eval tempField=mvzip(mvzip(endpoint,service),status)
 | stats count by _time,tempField
 | eval endpoint=mvindex(split(tempField,","),0), service=mvindex(split(tempField,","),1), status=mvindex(split(tempField,","),1)
 | search status="5*"
 | stats count by endpoint,service
- Mark as New
- Bookmark Message
- Subscribe to Message
- Mute Message
- Subscribe to RSS Feed
- Permalink
- Report Inappropriate Content
Quick Update. I got the below working.
host=mashery_production "data{}.http_status_code"= 5*
 | rename data{}.endpoint_name as endpoint, data{}.service_name as service, data{}.http_status_code as status | eval tempField=mvzip(mvzip(endpoint,service),status) | eval endpoint=mvindex(split(tempField,","),0), service=mvindex(split(tempField,","),1), status=mvindex(split(tempField,","),2)  | stats count by endpoint,service
The 2 changes were :
- Corrected the index on the last split on the temp field for status from 1 to 2. That must have been a type.
- Removed search status="5*"
Thanks a lot for the help.
- Mark as New
- Bookmark Message
- Subscribe to Message
- Mute Message
- Subscribe to RSS Feed
- Permalink
- Report Inappropriate Content
HI technie101,
Great,
If It helps you then can you please accept this answer to close this question ??
Thanks
- Mark as New
- Bookmark Message
- Subscribe to Message
- Mute Message
- Subscribe to RSS Feed
- Permalink
- Report Inappropriate Content
host=mashery_production "data{}.http_status_code"= inactive | eval endpoint='data{}.endpoint' | eval service='data{}.service' | Stats Count("data{}.status") as Count by endpoint, service | where Error_Count > 0
Perhaps? Using the values function is expected to provide multiple values, if you are trying to get a count with a value per endpoint/service then you would write something like the above...


