Turn on suggestions
Auto-suggest helps you quickly narrow down your search results by suggesting possible matches as you type.
Dashboards & Visualizations
×
Join the Conversation
Without signing in, you're just watching from the sidelines. Sign in or Register to connect, share, and be part of the Splunk Community.
Turn on suggestions
Auto-suggest helps you quickly narrow down your search results by suggesting possible matches as you type.
- Find Answers
- :
- Using Splunk
- :
- Dashboards & Visualizations
- :
- sparkline not show trends
Options
- Subscribe to RSS Feed
- Mark Topic as New
- Mark Topic as Read
- Float this Topic for Current User
- Bookmark Topic
- Subscribe to Topic
- Mute Topic
- Printer Friendly Page
- Mark as New
- Bookmark Message
- Subscribe to Message
- Mute Message
- Subscribe to RSS Feed
- Permalink
- Report Inappropriate Content
sparkline not show trends
raindrop18
Communicator
11-07-2018
02:35 PM

sourcetype=metrics name=http*://* rename "data.avg_response_time_ms" as avg_response_time_sec , "data.avg_error_rate" as avg_error_rate | eval avg_response_time_sec=avg_response_time_sec/1000 | eval avg_response_sec=round(avg_response_sec,2)| stats sparkline(avg(avg_response_time_sec),5m) as Trend by name,avg_response_time_sec ,avg_error_rate
- Mark as New
- Bookmark Message
- Subscribe to Message
- Mute Message
- Subscribe to RSS Feed
- Permalink
- Report Inappropriate Content
HiroshiSatoh
Champion
11-07-2018
09:45 PM
Is it correct that avg_response_time_sec exists in ”by name, avg_response_time_sec, avg_error_rate”?
- Mark as New
- Bookmark Message
- Subscribe to Message
- Mute Message
- Subscribe to RSS Feed
- Permalink
- Report Inappropriate Content
raindrop18
Communicator
11-08-2018
09:01 AM
yes. that's correct and return the data.
- Mark as New
- Bookmark Message
- Subscribe to Message
- Mute Message
- Subscribe to RSS Feed
- Permalink
- Report Inappropriate Content
HiroshiSatoh
Champion
11-09-2018
12:55 AM
Is the numerical value of avg_response_time_sec rounded to 0?
0.000001 is displayed, but 0.0000001 is 0.
- Mark as New
- Bookmark Message
- Subscribe to Message
- Mute Message
- Subscribe to RSS Feed
- Permalink
- Report Inappropriate Content
raindrop18
Communicator
11-21-2018
12:09 PM
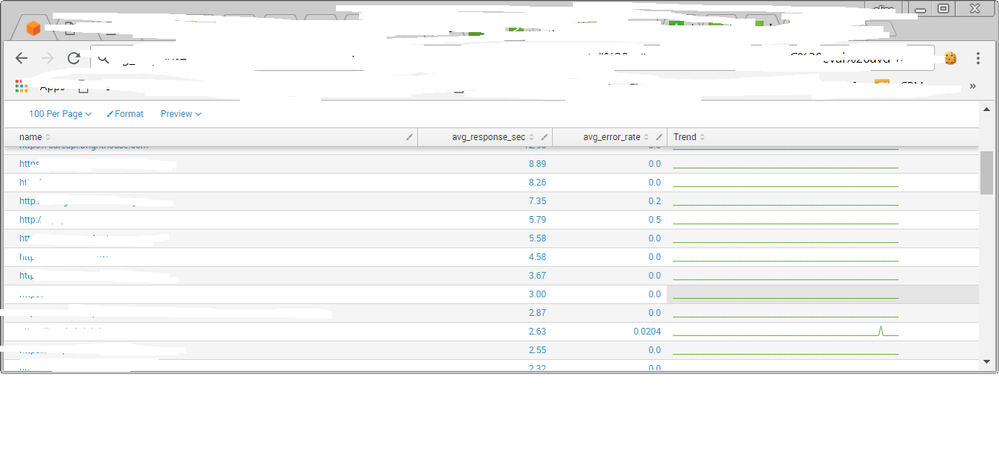
I have updated with rounding to 2 decimal point but the sparkling still not changed, also attached screenshot.
- Mark as New
- Bookmark Message
- Subscribe to Message
- Mute Message
- Subscribe to RSS Feed
- Permalink
- Report Inappropriate Content
HiroshiSatoh
Champion
11-25-2018
06:37 PM
The screen image and the search sentence do not match.
Please upload the correct search sentence again. Also please tell me the extraction period.
Get Updates on the Splunk Community!
Upcoming Webinar: Unmasking Insider Threats with Slunk Enterprise Security’s UEBA
Join us on Wed, Dec 10. at 10AM PST / 1PM EST for a live webinar and demo with Splunk experts! Discover how ...
.conf25 technical session recap of Observability for Gen AI: Monitoring LLM ...
If you’re unfamiliar, .conf is Splunk’s premier event where the Splunk community, customers, partners, and ...
A Season of Skills: New Splunk Courses to Light Up Your Learning Journey
There’s something special about this time of year—maybe it’s the glow of the holidays, maybe it’s the ...
