Join the Conversation
- Find Answers
- :
- Using Splunk
- :
- Dashboards & Visualizations
- :
- Re: "N/A" percentage in Single Value tile due to d...
- Subscribe to RSS Feed
- Mark Topic as New
- Mark Topic as Read
- Float this Topic for Current User
- Bookmark Topic
- Subscribe to Topic
- Mute Topic
- Printer Friendly Page
- Mark as New
- Bookmark Message
- Subscribe to Message
- Mute Message
- Subscribe to RSS Feed
- Permalink
- Report Inappropriate Content
"N/A" percentage in Single Value tile due to division by zero
Hello All,
I encountered a visualization issue in the Single Value tile on Splunk Enterprise 7 when the current value is greater than zero and the compared old value is zero: the displayed percentage change is displayed as "N/A" due to the division by 0 in the percentage ratio calculation (x/0 * 100).
Even if the result is mathematically correct, displaying "N/A" makes the user think that something is not working as expected in Splunk or that some data are corrupted.
The only workaround I found till now is replacing the 0 values with a little higher value between 0 and 0.1 (e.g. 0.001 or 0.999), but the displayed percentage is obviously ugly (e.g. 500000 for current value 5, when using 0,001 instead of 0).
The query is just a count of some events, so, after the base search, it ends with "| timechart span=1h count by key".
Have anyone a solution or a better workaround?
Thanks,
G.P.
- Mark as New
- Bookmark Message
- Subscribe to Message
- Mute Message
- Subscribe to RSS Feed
- Permalink
- Report Inappropriate Content
"N/A" seems appropriate, but perhaps it doesn't fit your use case. Consider detecting the divide-by-zero case in your query.
| eval pct = if(bar=0, 0, foo * 100 /bar)
If this reply helps you, Karma would be appreciated.
- Mark as New
- Bookmark Message
- Subscribe to Message
- Mute Message
- Subscribe to RSS Feed
- Permalink
- Report Inappropriate Content
Hi richgalloway,
thanks for the answer. I just updated the initial post with some additional details.
My query ends with "| timechart span=1h count by key", because the tile displays the current amount of some filtered events and the percentage change compared to 7 days before. The value is often 0, so when the current value is more than 0 and the old one is 0, the percentage is "N/A".
I guess that your suggestion is trying to replace the calculation of the percentage, isn't it?
However, I think that I cannot change how it is calculated, just the data it uses, am I wrong?
Thanks,
G.P.
- Mark as New
- Bookmark Message
- Subscribe to Message
- Mute Message
- Subscribe to RSS Feed
- Permalink
- Report Inappropriate Content
Yes, my sample SPL changes how the percentage is calculated. How exactly you should do it depends on your query. Your timechart command is not do the calculation, but you share the part of the query that is doing it then perhaps I can offer a better fix.
If this reply helps you, Karma would be appreciated.
- Mark as New
- Bookmark Message
- Subscribe to Message
- Mute Message
- Subscribe to RSS Feed
- Permalink
- Report Inappropriate Content
Ok, thanks. This is the simplest query among the ones with this issue:
level="INFO"
| timechart span=1h count
I am not sure how to set the "eval" part you suggested, since I tried to change the foo and bar variables according to my count, but I have no reference to the 7-days-before in the search query: it is automatically calculated by Splunk when I choose "percent" and "7 days before" in the single value chart format menu.
And this is a chart with the "N/A" issue:
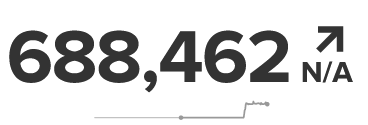
Here another example, but with only more filters in the search (everything else is the same as above):

Thanks in advance
Accelerating Observability as Code with the Splunk AI Assistant
Integrating Splunk Search API and Quarto to Create Reproducible Investigation ...
Congratulations to the 2025-2026 SplunkTrust!
