Are you a member of the Splunk Community?
- Find Answers
- :
- Using Splunk
- :
- Dashboards & Visualizations
- :
- Re: draw a theshold line with predict
- Subscribe to RSS Feed
- Mark Topic as New
- Mark Topic as Read
- Float this Topic for Current User
- Bookmark Topic
- Subscribe to Topic
- Mute Topic
- Printer Friendly Page
- Mark as New
- Bookmark Message
- Subscribe to Message
- Mute Message
- Subscribe to RSS Feed
- Permalink
- Report Inappropriate Content
HI,
I have a graph that draws capacity and utilisation and predicts utilisation into the future.
I want to draw a threshold line for capacity , but the threshold's could to be either
- the latest value of the capacity, i.e straight line across the graph
- the value of the capacity at the point of time , but no prediction to the future
I am fine with either option as I just want to see when the predicted utilisation will "cross" the capacity threshold
The threshold should be calculated, as I don't want to update the search/graph every time we change the capacity
here is what i have, but as mentioned I want the threshold not to be predicted
index=_introspection (host=idx*) component=Partitions
| spath output=capacity path=data.capacity
| spath output=available path=data.available
| eval utilised=(capacity - available) / 1024 , capacity = capacity/ 1024
| search *cold
| timechart span=1h max(utilised) as utilised_max p95(utilised) as utilised_p95 last(capacity) as capacity limit=100
| predict utilised_max as predict_max utilised_p95 as predict_p95 capacity as capacity future_timespan=168
| fields - upper95* lower95*
Thanks
- Mark as New
- Bookmark Message
- Subscribe to Message
- Mute Message
- Subscribe to RSS Feed
- Permalink
- Report Inappropriate Content
[UPDATED ANSWER] Move the | filldown Threshold to after the predict command. Refer to updated answer below. Alternatively as suggested you can also change the chart Format to treat Null Values as connected. This is like applying filldown to all the series in the chart.
@ilya_resh before prediction threshold, in order to improve your searh performance, you should move *cold to the main search instead of | search *cold.
Before the timechart command use eventstats to get the latest capacity as Threshold.
After timechart you can use filldown command to draw the threshold line throughout (you can also use chart options for null values through dashboard edit option for the chart as well.)
Please try out and confirm!
index=_introspection (host=*) component=Partitions "*cold"
| spath output=capacity path=data.capacity
| spath output=available path=data.available
| eval utilised=(capacity - available) / 1024 , capacity = capacity/ 1024
| eventstats latest(capacity) as Threshold
| timechart span=1h latest(Threshold) as Threshold max(utilised) as utilised_max p95(utilised) as utilised_p95 last(capacity) as capacity limit=100
| predict utilised_max as predict_max utilised_p95 as predict_p95 capacity as capacity future_timespan=168
| filldown Threshold
| fields - upper95* lower95*
| makeresults | eval message= "Happy Splunking!!!"
- Mark as New
- Bookmark Message
- Subscribe to Message
- Mute Message
- Subscribe to RSS Feed
- Permalink
- Report Inappropriate Content
- Mark as New
- Bookmark Message
- Subscribe to Message
- Mute Message
- Subscribe to RSS Feed
- Permalink
- Report Inappropriate Content
Thanks for the details. Please refer to updated answer below. All you need is to move the filldown command below predict.
| makeresults | eval message= "Happy Splunking!!!"
- Mark as New
- Bookmark Message
- Subscribe to Message
- Mute Message
- Subscribe to RSS Feed
- Permalink
- Report Inappropriate Content
[UPDATED ANSWER] Move the | filldown Threshold to after the predict command. Refer to updated answer below. Alternatively as suggested you can also change the chart Format to treat Null Values as connected. This is like applying filldown to all the series in the chart.
@ilya_resh before prediction threshold, in order to improve your searh performance, you should move *cold to the main search instead of | search *cold.
Before the timechart command use eventstats to get the latest capacity as Threshold.
After timechart you can use filldown command to draw the threshold line throughout (you can also use chart options for null values through dashboard edit option for the chart as well.)
Please try out and confirm!
index=_introspection (host=*) component=Partitions "*cold"
| spath output=capacity path=data.capacity
| spath output=available path=data.available
| eval utilised=(capacity - available) / 1024 , capacity = capacity/ 1024
| eventstats latest(capacity) as Threshold
| timechart span=1h latest(Threshold) as Threshold max(utilised) as utilised_max p95(utilised) as utilised_p95 last(capacity) as capacity limit=100
| predict utilised_max as predict_max utilised_p95 as predict_p95 capacity as capacity future_timespan=168
| filldown Threshold
| fields - upper95* lower95*
| makeresults | eval message= "Happy Splunking!!!"
- Mark as New
- Bookmark Message
- Subscribe to Message
- Mute Message
- Subscribe to RSS Feed
- Permalink
- Report Inappropriate Content
Hi @niketnilay
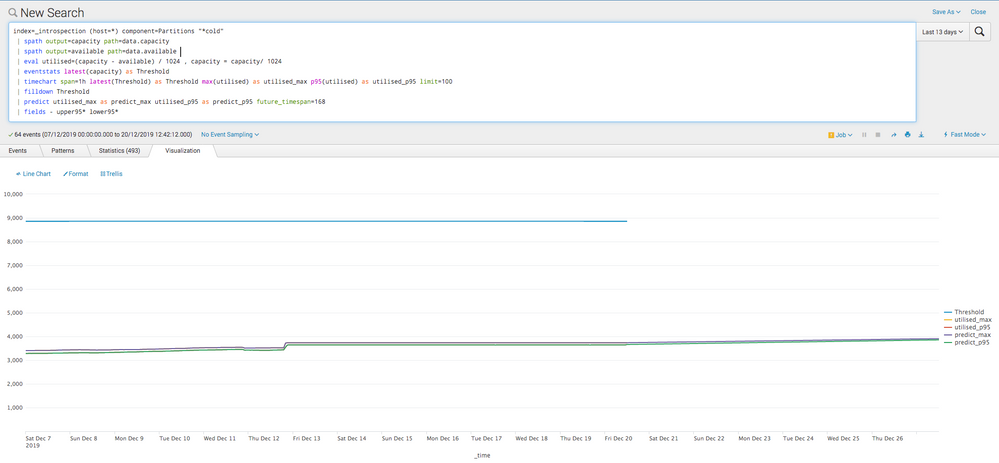
Here is the result
You will see that the Threshold line ends at the current time point, but I want it to go all the way till the end of the predicted time period so that I can see when the predicted utilisation will cross the Threshold line.
(had to post it as answer, as can't attach files from drive in comments)
- Mark as New
- Bookmark Message
- Subscribe to Message
- Mute Message
- Subscribe to RSS Feed
- Permalink
- Report Inappropriate Content
Moving filldown to after the predict worked like magic, thank you very much @niketnilay
- Mark as New
- Bookmark Message
- Subscribe to Message
- Mute Message
- Subscribe to RSS Feed
- Permalink
- Report Inappropriate Content
Sure. Once you post image as answer, you can convert the same to comment. I have done that for you! Please try the updated answer and confirm!
| makeresults | eval message= "Happy Splunking!!!"


