Turn on suggestions
Auto-suggest helps you quickly narrow down your search results by suggesting possible matches as you type.
Dashboards & Visualizations
×
Join the Conversation
Without signing in, you're just watching from the sidelines. Sign in or Register to connect, share, and be part of the Splunk Community.
Turn on suggestions
Auto-suggest helps you quickly narrow down your search results by suggesting possible matches as you type.
- Find Answers
- :
- Using Splunk
- :
- Dashboards & Visualizations
- :
- Why is the Time Selection not working when I click...
Options
- Subscribe to RSS Feed
- Mark Topic as New
- Mark Topic as Read
- Float this Topic for Current User
- Bookmark Topic
- Subscribe to Topic
- Mute Topic
- Printer Friendly Page
- Mark as New
- Bookmark Message
- Subscribe to Message
- Mute Message
- Subscribe to RSS Feed
- Permalink
- Report Inappropriate Content
robertlynch2020
Influencer
02-22-2022
09:50 AM
Hi
The <Selection> in the bottom code is not working correctly and I can't figure out why.
I am looking to select the time when I click on a bar on the graph. To give me the time of the bar, however, it is always giving me the start time of the graph and not the zoomed-in time of the bar.
<panel depends="$host_token$">
<chart>
<title>Sig Events Error Count by MX Component</title>
<search>
<query>| mstats max("mx.process.errors") prestats=true WHERE "index"="metrics_test" AND mx.env=$host_token$ AND log.type=sig-event span=60s BY "log.type" pid replica.name service.name | search "psrsvd_nx_mx.process.errors" > 0
| rename "service.name" as service_name
| rename "replica.name" as replica_name
| eval Process_Name=((service_name . " # ") . replica_name)
| timechart max("mx.process.errors") AS Error_Log_Nb by Process_Name limit=10000
| eval Error_Log_Nb=substr(Error_Log_Nb, 1, len(Error_Log_Nb)-7)</query>
<earliest>$time_token.earliest$</earliest>
<latest>$time_token.latest$</latest>
<sampleRatio>1</sampleRatio>
</search>
<option name="charting.chart">column</option>
<option name="charting.legend.placement">bottom</option>
<option name="refresh.display">progressbar</option>
<selection>
<set token="time_token_selection.earliest">$start$</set>
<!--set token="time_token_selection.latest">$end$</set-->
<eval token="time_token_selection.latest">$time_token_selection.earliest$+5</eval>
</selection>
</chart>
</panel>
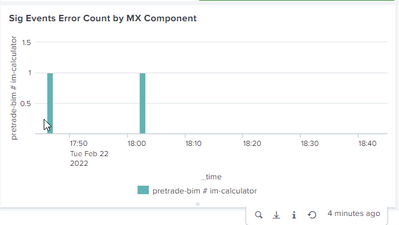
IN the below we can see i am click on the bar
However, the time in the tokens is the start and end, not the time on the bar that i have clicked on.
Regards
Robert
1 Solution
- Mark as New
- Bookmark Message
- Subscribe to Message
- Mute Message
- Subscribe to RSS Feed
- Permalink
- Report Inappropriate Content
robertlynch2020
Influencer
02-23-2022
07:13 AM
In the end, i had this all wrong - the code needs to be in the drill-down - like below.
<panel depends="$host_token$">
<title>Significant Events - Last 5m</title>
<single>
<search base="Basesearch_SIG_EVENTS">
<query>
| stats count as Errors
</query>
</search>
<option name="colorMode">block</option>
<option name="drilldown">all</option>
<option name="height">76</option>
<option name="rangeColors">["0x006d9c","0x006d9c"]</option>
<option name="rangeValues">[0]</option>
<option name="refresh.display">progressbar</option>
<option name="unit">Sig Event(s)</option>
<option name="useColors">1</option>
<drilldown>
<set token="time_token_selection.earliest">$earliest$</set>
<set token="time_token_selection.latest">$latest$</set>
<link target="_blank">http://splunk:8000/en-GB/app/$app_name$/$Dashboard_SIGNIFICANT_EVENTS$?host_token1=$host_token$&URL_TRAP=SET&Severity_token1=*&form.time_token.earliest=$time_token_selection.earliest$&form.time_token.latest=$time_token_selection.latest$&Service_Name1=*</link>
</drilldown>
</single>
</panel>- Mark as New
- Bookmark Message
- Subscribe to Message
- Mute Message
- Subscribe to RSS Feed
- Permalink
- Report Inappropriate Content
robertlynch2020
Influencer
02-23-2022
07:13 AM
In the end, i had this all wrong - the code needs to be in the drill-down - like below.
<panel depends="$host_token$">
<title>Significant Events - Last 5m</title>
<single>
<search base="Basesearch_SIG_EVENTS">
<query>
| stats count as Errors
</query>
</search>
<option name="colorMode">block</option>
<option name="drilldown">all</option>
<option name="height">76</option>
<option name="rangeColors">["0x006d9c","0x006d9c"]</option>
<option name="rangeValues">[0]</option>
<option name="refresh.display">progressbar</option>
<option name="unit">Sig Event(s)</option>
<option name="useColors">1</option>
<drilldown>
<set token="time_token_selection.earliest">$earliest$</set>
<set token="time_token_selection.latest">$latest$</set>
<link target="_blank">http://splunk:8000/en-GB/app/$app_name$/$Dashboard_SIGNIFICANT_EVENTS$?host_token1=$host_token$&URL_TRAP=SET&Severity_token1=*&form.time_token.earliest=$time_token_selection.earliest$&form.time_token.latest=$time_token_selection.latest$&Service_Name1=*</link>
</drilldown>
</single>
</panel>
Get Updates on the Splunk Community!
[Puzzles] Solve, Learn, Repeat: Dynamic formatting from XML events
This challenge was first posted on Slack #puzzles channelFor a previous puzzle, I needed a set of fixed-length ...
Enter the Agentic Era with Splunk AI Assistant for SPL 1.4
🚀 Your data just got a serious AI upgrade — are you ready?
Say hello to the Agentic Era with the ...
Stronger Security with Federated Search for S3, GCP SQL & Australian Threat ...
Splunk Lantern is a Splunk customer success center that provides advice from Splunk experts on valuable data ...


