Turn on suggestions
Auto-suggest helps you quickly narrow down your search results by suggesting possible matches as you type.
Dashboards & Visualizations
×
Join the Conversation
Without signing in, you're just watching from the sidelines. Sign in or Register to connect, share, and be part of the Splunk Community.
Turn on suggestions
Auto-suggest helps you quickly narrow down your search results by suggesting possible matches as you type.
- Find Answers
- :
- Using Splunk
- :
- Dashboards & Visualizations
- :
- Re: Why is the Time Selection not working when I c...
Options
- Subscribe to RSS Feed
- Mark Topic as New
- Mark Topic as Read
- Float this Topic for Current User
- Bookmark Topic
- Subscribe to Topic
- Mute Topic
- Printer Friendly Page
- Mark as New
- Bookmark Message
- Subscribe to Message
- Mute Message
- Subscribe to RSS Feed
- Permalink
- Report Inappropriate Content
robertlynch2020
Influencer
02-22-2022
09:50 AM
Hi
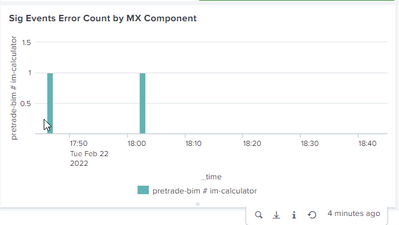
The <Selection> in the bottom code is not working correctly and I can't figure out why.
I am looking to select the time when I click on a bar on the graph. To give me the time of the bar, however, it is always giving me the start time of the graph and not the zoomed-in time of the bar.
<panel depends="$host_token$">
<chart>
<title>Sig Events Error Count by MX Component</title>
<search>
<query>| mstats max("mx.process.errors") prestats=true WHERE "index"="metrics_test" AND mx.env=$host_token$ AND log.type=sig-event span=60s BY "log.type" pid replica.name service.name | search "psrsvd_nx_mx.process.errors" > 0
| rename "service.name" as service_name
| rename "replica.name" as replica_name
| eval Process_Name=((service_name . " # ") . replica_name)
| timechart max("mx.process.errors") AS Error_Log_Nb by Process_Name limit=10000
| eval Error_Log_Nb=substr(Error_Log_Nb, 1, len(Error_Log_Nb)-7)</query>
<earliest>$time_token.earliest$</earliest>
<latest>$time_token.latest$</latest>
<sampleRatio>1</sampleRatio>
</search>
<option name="charting.chart">column</option>
<option name="charting.legend.placement">bottom</option>
<option name="refresh.display">progressbar</option>
<selection>
<set token="time_token_selection.earliest">$start$</set>
<!--set token="time_token_selection.latest">$end$</set-->
<eval token="time_token_selection.latest">$time_token_selection.earliest$+5</eval>
</selection>
</chart>
</panel>
IN the below we can see i am click on the bar
However, the time in the tokens is the start and end, not the time on the bar that i have clicked on.
Regards
Robert
1 Solution
- Mark as New
- Bookmark Message
- Subscribe to Message
- Mute Message
- Subscribe to RSS Feed
- Permalink
- Report Inappropriate Content
robertlynch2020
Influencer
02-23-2022
07:13 AM
In the end, i had this all wrong - the code needs to be in the drill-down - like below.
<panel depends="$host_token$">
<title>Significant Events - Last 5m</title>
<single>
<search base="Basesearch_SIG_EVENTS">
<query>
| stats count as Errors
</query>
</search>
<option name="colorMode">block</option>
<option name="drilldown">all</option>
<option name="height">76</option>
<option name="rangeColors">["0x006d9c","0x006d9c"]</option>
<option name="rangeValues">[0]</option>
<option name="refresh.display">progressbar</option>
<option name="unit">Sig Event(s)</option>
<option name="useColors">1</option>
<drilldown>
<set token="time_token_selection.earliest">$earliest$</set>
<set token="time_token_selection.latest">$latest$</set>
<link target="_blank">http://splunk:8000/en-GB/app/$app_name$/$Dashboard_SIGNIFICANT_EVENTS$?host_token1=$host_token$&URL_TRAP=SET&Severity_token1=*&form.time_token.earliest=$time_token_selection.earliest$&form.time_token.latest=$time_token_selection.latest$&Service_Name1=*</link>
</drilldown>
</single>
</panel>- Mark as New
- Bookmark Message
- Subscribe to Message
- Mute Message
- Subscribe to RSS Feed
- Permalink
- Report Inappropriate Content
robertlynch2020
Influencer
02-23-2022
07:13 AM
In the end, i had this all wrong - the code needs to be in the drill-down - like below.
<panel depends="$host_token$">
<title>Significant Events - Last 5m</title>
<single>
<search base="Basesearch_SIG_EVENTS">
<query>
| stats count as Errors
</query>
</search>
<option name="colorMode">block</option>
<option name="drilldown">all</option>
<option name="height">76</option>
<option name="rangeColors">["0x006d9c","0x006d9c"]</option>
<option name="rangeValues">[0]</option>
<option name="refresh.display">progressbar</option>
<option name="unit">Sig Event(s)</option>
<option name="useColors">1</option>
<drilldown>
<set token="time_token_selection.earliest">$earliest$</set>
<set token="time_token_selection.latest">$latest$</set>
<link target="_blank">http://splunk:8000/en-GB/app/$app_name$/$Dashboard_SIGNIFICANT_EVENTS$?host_token1=$host_token$&URL_TRAP=SET&Severity_token1=*&form.time_token.earliest=$time_token_selection.earliest$&form.time_token.latest=$time_token_selection.latest$&Service_Name1=*</link>
</drilldown>
</single>
</panel>
Get Updates on the Splunk Community!
Index This | What is broken 80% of the time by February?
December 2025 Edition
Hayyy Splunk Education Enthusiasts and the Eternally Curious!
We’re back with this ...
Unlock Faster Time-to-Value on Edge and Ingest Processor with New SPL2 Pipeline ...
Hello Splunk Community,
We're thrilled to share an exciting update that will help you manage your data more ...
Splunk MCP & Agentic AI: Machine Data Without Limits
Discover how the Splunk Model Context Protocol (MCP) Server can revolutionize the way your organization uses ...


