Are you a member of the Splunk Community?
- Find Answers
- :
- Using Splunk
- :
- Dashboards & Visualizations
- :
- Re: Why does only 1 of 3 conditional drilldowns wo...
- Subscribe to RSS Feed
- Mark Topic as New
- Mark Topic as Read
- Float this Topic for Current User
- Bookmark Topic
- Subscribe to Topic
- Mute Topic
- Printer Friendly Page
- Mark as New
- Bookmark Message
- Subscribe to Message
- Mute Message
- Subscribe to RSS Feed
- Permalink
- Report Inappropriate Content
I have a dashboard with one search and basically it has 3 conditional drilldowns routing to 3 different dashboards. My first conditional drilldown works perfectly, but the rest are not working. Not sure where I'm going wrong. Any help is appreciated.
In the dashboard, this is my search:
sourcetype=opl_soa RFault="remoteFault" source="/logs/SOA_MS*-diagnostic.log" host="mialvsoaap0*p" | append [search BFault="bindingFault" source="/logs/SOA_MS*-diagnostic.log" host="mialvsoaap0*p"] | append [search BusinessFault ="business fault" source="/logs/SOA_MS*-diagnostic.log" host="mialvsoaap0*p"]|timechart span=5m count(RFault) as RemoteFaults, count(BFault="bindingFault") as BindingFaults,count(BusinessFault ="business fault") as BusinessFaults
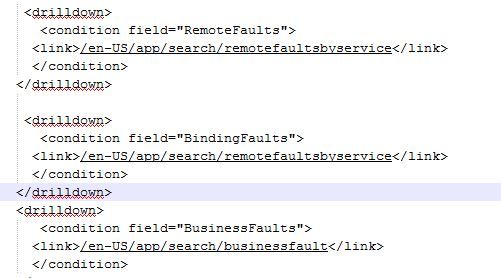
and I have 3 drilldowns pointing to 3 different dashboards in the main dashboard where the above search is residing.
First one works and the other two do not. Any suggestions? Attached the code image:
- Mark as New
- Bookmark Message
- Subscribe to Message
- Mute Message
- Subscribe to RSS Feed
- Permalink
- Report Inappropriate Content
I believe you should put all three condition blocks within one drilldown block instead of separate ones.
- Mark as New
- Bookmark Message
- Subscribe to Message
- Mute Message
- Subscribe to RSS Feed
- Permalink
- Report Inappropriate Content
I believe you should put all three condition blocks within one drilldown block instead of separate ones.
- Mark as New
- Bookmark Message
- Subscribe to Message
- Mute Message
- Subscribe to RSS Feed
- Permalink
- Report Inappropriate Content
You can put anything you like in an html panel, including links. http://docs.splunk.com/Documentation/Splunk/6.4.0/Viz/PanelreferenceforSimplifiedXML#html
- Mark as New
- Bookmark Message
- Subscribe to Message
- Mute Message
- Subscribe to RSS Feed
- Permalink
- Report Inappropriate Content
Thank You ! it worked . one more question .
On the Main dash board , i have a timer on the panel and if i want to default it to last 4 hours . how can i do that ?
the reason is if i drill down to some other page and get back to main dashboard , My timer on the main dashboard will start pulling "ALL time " by default and i want it to be defaulted to 4 hours and if anybody want to search based on some other time , then they can set it to some other time like last 24 hors , last 60 mins etc .
- Mark as New
- Bookmark Message
- Subscribe to Message
- Mute Message
- Subscribe to RSS Feed
- Permalink
- Report Inappropriate Content
Edit panels (top right corner), edit time range picker (pencil icon), select default time range you like.
- Mark as New
- Bookmark Message
- Subscribe to Message
- Mute Message
- Subscribe to RSS Feed
- Permalink
- Report Inappropriate Content
Thanks a lot for help ! it worked .
- Mark as New
- Bookmark Message
- Subscribe to Message
- Mute Message
- Subscribe to RSS Feed
- Permalink
- Report Inappropriate Content
Thank You ! it worked .
One more question ..
Is there any option where I can traversere from Sub dashboards to Main Dashboard ?
For example i have one Main dashboard where in i can drill down to 3 sub sub dashboards .
When i go to sub dashboard , can i have a link pointing to Main Dashboard and after clicking it routes to main dashboard ?
-pavan
- Mark as New
- Bookmark Message
- Subscribe to Message
- Mute Message
- Subscribe to RSS Feed
- Permalink
- Report Inappropriate Content
Slightly off-topic: Do not append three searches to each other. Instead, use OR:
sourcetype=opl_soa source="/logs/SOA_MS*-diagnostic.log" host="mialvsoaap0*p" (RFault="remoteFault" OR BFault="bindingFault" OR BusinessFault="business fault" | timechart ...
Should run much faster.
- Mark as New
- Bookmark Message
- Subscribe to Message
- Mute Message
- Subscribe to RSS Feed
- Permalink
- Report Inappropriate Content
H Martin ,
Do you have any idea/ suggestions about this thread ?
https://answers.splunk.com/answers/399941/adding-colors-based-on-search-results.html

