Are you a member of the Splunk Community?
- Find Answers
- :
- Using Splunk
- :
- Dashboards & Visualizations
- :
- Using job.resultCount to add up multiple SingleVal...
- Subscribe to RSS Feed
- Mark Topic as New
- Mark Topic as Read
- Float this Topic for Current User
- Bookmark Topic
- Subscribe to Topic
- Mute Topic
- Printer Friendly Page
- Mark as New
- Bookmark Message
- Subscribe to Message
- Mute Message
- Subscribe to RSS Feed
- Permalink
- Report Inappropriate Content
Hello there,
im trying to work with the job.resultCount token, but I can't really figure it out.
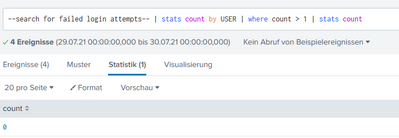
I have this pretty basic search:
Its supposed to return the amount of login attempts, grouped by user and with more than 1 attempt per day.
I display the result ( 0 ) as a SingleValue panel in my dashboard. Now I want to sump up this result and results from other SingleValue Panels into a new Panel, to see how many patterns returned at least one result.
To get that information, I use the below code to set a token for each panel, which will be added up later.
<done>
   <condition match="'job.resultCount' = 0">
      <set token="panel_failedLogons">0</set>
   </condition>
   <condition>
      <set token="panel_failedLogons">1</set>
   </condition>
</done>
Problem is, as the | stats count command creates a row displaying 0 results, its counts as a result and therefor the token is set to 1. I also cannot use job.eventCount as there may be single failed login attempts for a user.
Any ideas how I can bypass/solve this particular problem?
- Mark as New
- Bookmark Message
- Subscribe to Message
- Mute Message
- Subscribe to RSS Feed
- Permalink
- Report Inappropriate Content
I should have thought about it five minutes longer. I solved it now.
You can use $result.count$ to access the internal field of the search.
<done>
   <condition match="'result.count' = 0">
      <set token="panel_failedLogons">0</set>
   </condition>
   <condition>
      <set token="panel_failedLogons">1</set>
   </condition>
</done>
Maybe this will help somebody else.

