Join the Conversation
- Find Answers
- :
- Using Splunk
- :
- Dashboards & Visualizations
- :
- Using color in reports (saved search) table based ...
- Subscribe to RSS Feed
- Mark Topic as New
- Mark Topic as Read
- Float this Topic for Current User
- Bookmark Topic
- Subscribe to Topic
- Mute Topic
- Printer Friendly Page
- Mark as New
- Bookmark Message
- Subscribe to Message
- Mute Message
- Subscribe to RSS Feed
- Permalink
- Report Inappropriate Content
What I try to do, I can get to work in dashboard, but I would like it to work in reports (savedsearches.conf)
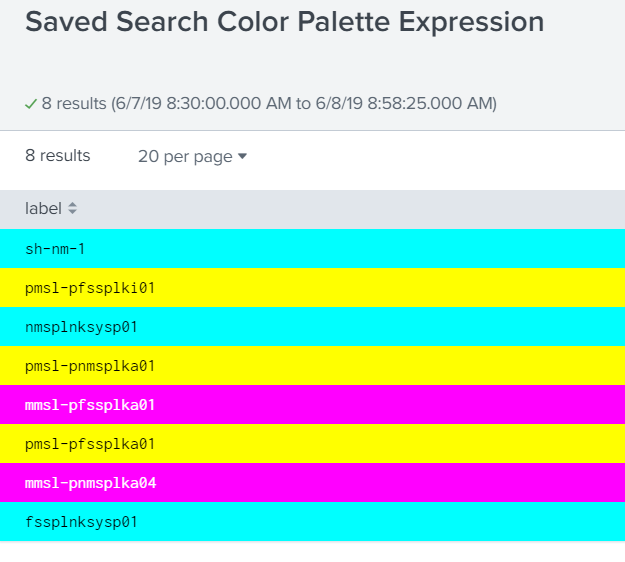
My data looks some like this
My search | rest /services/licenser/slaves | table label
sh-nm-1
pmsl-pfssplki01
nmsplnksysp01
pmsl-pnmsplka01
mmsl-pfssplka01
pmsl-pfssplka01
mmsl-pnmsplka04
fssplnksysp01
My goal is to differentiate system using color on the label column.
From the manual: https://docs.splunk.com/Documentation/Splunk/7.2.6/Admin/Savedsearchesconf
# Color format options
display.statistics.format.<index>.colorPalette = [expression|list|map|minMidMax|sharedList]
# Color palette options for 'expression'
display.statistics.format.<index>.colorPalette.rule = <string>
Here is what I have tried.
display.statistics.format.0 = color
display.statistics.format.0.colorPalette = expression
display.statistics.format.0.colorPalette.colors = case(like(label,"pmsl%"),"#ffff00",like(label,"mmsl%"),"#ff00ff",1=1,"#00ffff")
display.statistics.format.0.field = label
But no color are showing up. Case rule works fine.
Manual says nothing about how the <string> should look like.
A workaround is to create a new column and color it like this:
| rest /services/licenser/slaves | table label | eval customer=case(like(label,"pmsl%"),"systemA",like(label,"mmsl%"),"systemB",1=1,"old")
Than add color for systemA, systemB and old.
But I would like to get this to work for my original column. Anyone?
- Mark as New
- Bookmark Message
- Subscribe to Message
- Mute Message
- Subscribe to RSS Feed
- Permalink
- Report Inappropriate Content
@lakromani following settings worked fine for me. I had just got rid of percent sign % and used true() for default color.
display.statistics.format.0=color
display.statistics.format.0.field = label
display.statistics.format.0.colorPalette = expression
display.statistics.format.0.colorPalette.rule = case(like(value,"pmsl"),"#ffff00",like(value,"mmsl"),"#ff00ff",true(),"#00ffff")
Following two tips:
1) Splunk restart, refresh, bump and internet browser cache cleaning would be required for changes to reflect.
2) You should test your colorPalette expression changes in Dashboard table first to ensure they are working as expected, then apply the expression in Saved Search configuration.
| makeresults | eval message= "Happy Splunking!!!"
- Mark as New
- Bookmark Message
- Subscribe to Message
- Mute Message
- Subscribe to RSS Feed
- Permalink
- Report Inappropriate Content
It does work, thanks. 1=1 does also work.
But why did you change name to value? I thought I needed the field name as input.
Also it does not seem to like match(), only like()
like(value,"pmsl") OK
match(value,"pmsl") Not OK
Debug/refresh (or restart on free version) is needed to get it to work
Final result
display.statistics.format.1.colorPalette.rule = case(like(value,"_pms") OR like(value,"_PMS"),"#ffff00",like(value,"_mms") OR like(value,"_mms"),"#ff00ff",1=1,"#00ffff")
- Mark as New
- Bookmark Message
- Subscribe to Message
- Mute Message
- Subscribe to RSS Feed
- Permalink
- Report Inappropriate Content
Hi lakromani,
did you tried to schedule a dashboard?
in this way, you can use all the features of a dashboard (colours, images, etc...) and put them in a static scheduled dashboard that has pdf format and is very similar to a Report.
You have only to pone much attention to formatting, because if you have more panels maybe in the scheduled dashboard aren't aligned like the screen.
But if you have only one panel it's ok.
This is also a way to put a grafic in a report.
Bye.
Giuseppe
- Mark as New
- Bookmark Message
- Subscribe to Message
- Mute Message
- Subscribe to RSS Feed
- Permalink
- Report Inappropriate Content
I know that I can use dashboard, but Splunk describe in the manual that this should be possible with saved search as well. So its some strange that no one who can help out with this.

