Are you a member of the Splunk Community?
- Find Answers
- :
- Using Splunk
- :
- Dashboards & Visualizations
- :
- Re: Unable to get incidents loaded in the Alert Ma...
- Subscribe to RSS Feed
- Mark Topic as New
- Mark Topic as Read
- Float this Topic for Current User
- Bookmark Topic
- Subscribe to Topic
- Mute Topic
- Printer Friendly Page
- Mark as New
- Bookmark Message
- Subscribe to Message
- Mute Message
- Subscribe to RSS Feed
- Permalink
- Report Inappropriate Content
Hi All,
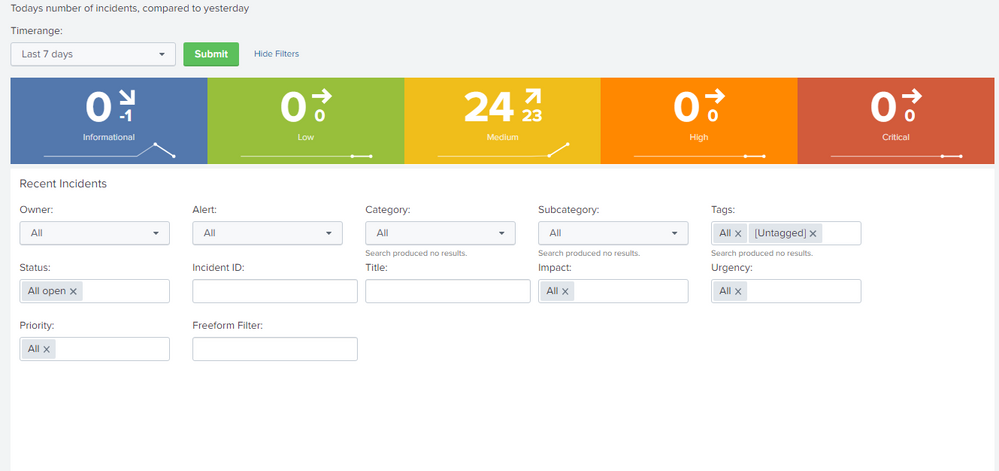
We're using Alert Manager as a solution to produce Incidents, just like the Incident review dashboard in the Enterprise Security Suite. We have followed all the instructions given in the document, yet are not able to display incidents in the Posture.
- We installed the app and the add-on on the search head
- Created an index called alerts
- Set the alerts in the Alert manager app. Assigned the default roles created by the app to the users using it.
- Changed the permissions of the all the alerts and macros, even the Posture dashboard to Global.
We're getting the data in the dashboard metrics, as visible in the screenshot. But the incidents are still not displaying. Can anyone help us in setting this. Also, do we really need to install the add on each of our Indexers as well? Will that solve the problem?
Thanks in advance
- Mark as New
- Bookmark Message
- Subscribe to Message
- Mute Message
- Subscribe to RSS Feed
- Permalink
- Report Inappropriate Content
Resolved it myself. The problem was like finding a needle in the haystack of sand in a desert. The search of the macro all_alerts had a field called result_ID. That wasn't producing any results. Removed it, updated and got the search working, updated the macro and boom. Results popped up in the dashboard.
Helpful tips for the app:
- Make your Incident posture dashboard's permissions setting to global, also do the same for your macros.
- Look for any errors in the data model, or the predefined searches of the macros.
- If you didn't make the index with the default name "alerts", make sure to update it in the app as well as in the macro.
- To get rid of the socket errors, consider increasing the ulimits of your search head and the self imposed limits of the REST API in the server.conf file.
- Mark as New
- Bookmark Message
- Subscribe to Message
- Mute Message
- Subscribe to RSS Feed
- Permalink
- Report Inappropriate Content
Thank you @shiv1593
This post helped me to fix the same issue I had.

