Join the Conversation
- Find Answers
- :
- Using Splunk
- :
- Dashboards & Visualizations
- :
- Re: Splunk Graph using 4 Fields combination
- Subscribe to RSS Feed
- Mark Topic as New
- Mark Topic as Read
- Float this Topic for Current User
- Bookmark Topic
- Subscribe to Topic
- Mute Topic
- Printer Friendly Page
- Mark as New
- Bookmark Message
- Subscribe to Message
- Mute Message
- Subscribe to RSS Feed
- Permalink
- Report Inappropriate Content
Hi,
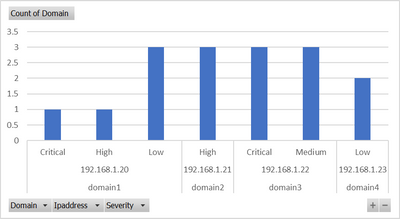
I am looking to plot a graph using four fields in splunk. Looking for relationship graph among Domain, Category , Ipaddress and Severity similar to excel graph as below.
Sample Data:
| Domain | Category | Ipaddress | Severity |
| domain1 | prod | 192.168.1.20 | Low |
| domain2 | non-prod | 192.168.1.21 | High |
| domain3 | prod | 192.168.1.22 | Critical |
| domain3 | prod | 192.168.1.22 | Medium |
| domain4 | non-prod | 192.168.1.23 | Low |
| domain1 | prod | 192.168.1.20 | Low |
| domain2 | non-prod | 192.168.1.21 | High |
| domain3 | prod | 192.168.1.22 | Critical |
| domain3 | prod | 192.168.1.22 | Medium |
| domain4 | non-prod | 192.168.1.23 | Low |
| domain1 | prod | 192.168.1.20 | Low |
| domain2 | non-prod | 192.168.1.21 | High |
| domain3 | prod | 192.168.1.22 | Critical |
| domain3 | prod | 192.168.1.22 | Medium |
| domain1 | prod | 192.168.1.20 | High |
| domain1 | prod | 192.168.1.20 | Critical |
Graph prepared using excel:
Please advise search command to see the relationship in Visualization to plot the graph.
- Mark as New
- Bookmark Message
- Subscribe to Message
- Mute Message
- Subscribe to RSS Feed
- Permalink
- Report Inappropriate Content
Hi @amgsplunk
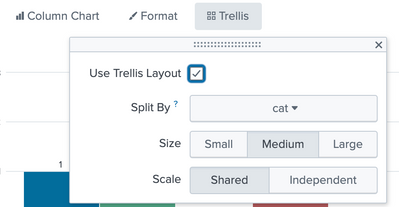
Try something with Trellis for your charts and turn on Legends as per your need
| inputlookup test1.csv
| eval cat = Domain+"-"+Category
| stats count(eval(Severity="Critical")) as Critical
    count(eval(Severity="High")) as High
    count(eval(Severity="Medium")) as Medium
    count(eval(Severity="Low")) as Low
    by Ipaddress cat
- Mark as New
- Bookmark Message
- Subscribe to Message
- Mute Message
- Subscribe to RSS Feed
- Permalink
- Report Inappropriate Content
Dear Gr0und_Z3r0,
Thank you very much for the solution. This is what I am looking.
- Mark as New
- Bookmark Message
- Subscribe to Message
- Mute Message
- Subscribe to RSS Feed
- Permalink
- Report Inappropriate Content
Thanks for your response. Graph is not showing the severity.
source="reports_19_1.csv" host="ClassES1" index="mallik_index_local" sourcetype="csv" |eval ipdomain=Domain." - ".Ipaddress
| stats count by ipdomain Category Severity
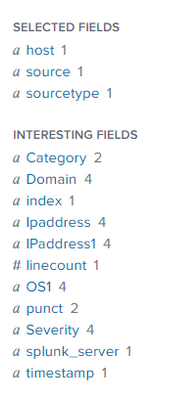
Not getting the desired output. I want to see domain, Ipaddress, Severity and category in the graph. Severity and Category fields are missing in the graph. The following is the visualization result from splunk search, visualization.
- Mark as New
- Bookmark Message
- Subscribe to Message
- Mute Message
- Subscribe to RSS Feed
- Permalink
- Report Inappropriate Content
As you wrote yourself, it's
<your search>
| stats count by Domain Ipaddress Category Severity
Nothing fancy.
In this case domain maps 1:1 with ipaddress so you might "squeeze" them into one field
<your search>
| eval ipdomain=Domain." - ".Ipaddress
| stats count by ipdomain Category Severity


