- Splunk Answers
- :
- Using Splunk
- :
- Dashboards & Visualizations
- :
- Splunk Dashboard to show the values in slices or a...
- Subscribe to RSS Feed
- Mark Topic as New
- Mark Topic as Read
- Float this Topic for Current User
- Bookmark Topic
- Subscribe to Topic
- Mute Topic
- Printer Friendly Page
- Mark as New
- Bookmark Message
- Subscribe to Message
- Mute Message
- Subscribe to RSS Feed
- Permalink
- Report Inappropriate Content
Hi Team,
I am trying to create a dashboard pie chart visualization with the spl query.
we have total_apps are 300, how many apps(count) are there out of this.
Note: why i am using "dc" here we have foo_foo_1, foo_foo_2, foo_foo_3 apps.
|rest /services/data/indexes
|rename title as index
|rex field=index "^foo_(?<appname>.+)"
|rex field=index "^foo_(?<appname>.+)_"
|table appname, index
|stats dc(appname) as currentapps
|eval currentapps = currentapps
|eval total_apps = 300
from this in pie chart its showing only total_apps or currentapps not both in single pie chart
so what is the issue.
- Mark as New
- Bookmark Message
- Subscribe to Message
- Mute Message
- Subscribe to RSS Feed
- Permalink
- Report Inappropriate Content
Try something like this
|rest /services/data/indexes
|rename title as index
|rex field=index "^foo_(?<appname>.+)"
|rex field=index "^foo_(?<appname>.+)_"
|table appname, index
|stats dc(appname) as count
|eval title = "currentapps"
| append
[| makeresults
| eval count = 300
| eval title="total_apps"]
| table title count- Mark as New
- Bookmark Message
- Subscribe to Message
- Mute Message
- Subscribe to RSS Feed
- Permalink
- Report Inappropriate Content
Thanks @ITWhisperer its working for me
- Mark as New
- Bookmark Message
- Subscribe to Message
- Mute Message
- Subscribe to RSS Feed
- Permalink
- Report Inappropriate Content
@ITWhisperer thanks for the response,
actually, I am creating a pie chart in dashboard that will show "totalapps" count and "appname" count on pie chart in two slices.
where our totalapps is 300, and i am extracting appnames using rex.
- Mark as New
- Bookmark Message
- Subscribe to Message
- Mute Message
- Subscribe to RSS Feed
- Permalink
- Report Inappropriate Content
Try something like this
|rest /services/data/indexes
|rename title as index
|rex field=index "^foo_(?<appname>.+)"
|rex field=index "^foo_(?<appname>.+)_"
|table appname, index
|stats dc(appname) as count
|eval title = "currentapps"
| append
[| makeresults
| eval count = 300
| eval title="total_apps"]
| table title count- Mark as New
- Bookmark Message
- Subscribe to Message
- Mute Message
- Subscribe to RSS Feed
- Permalink
- Report Inappropriate Content

- Mark as New
- Bookmark Message
- Subscribe to Message
- Mute Message
- Subscribe to RSS Feed
- Permalink
- Report Inappropriate Content
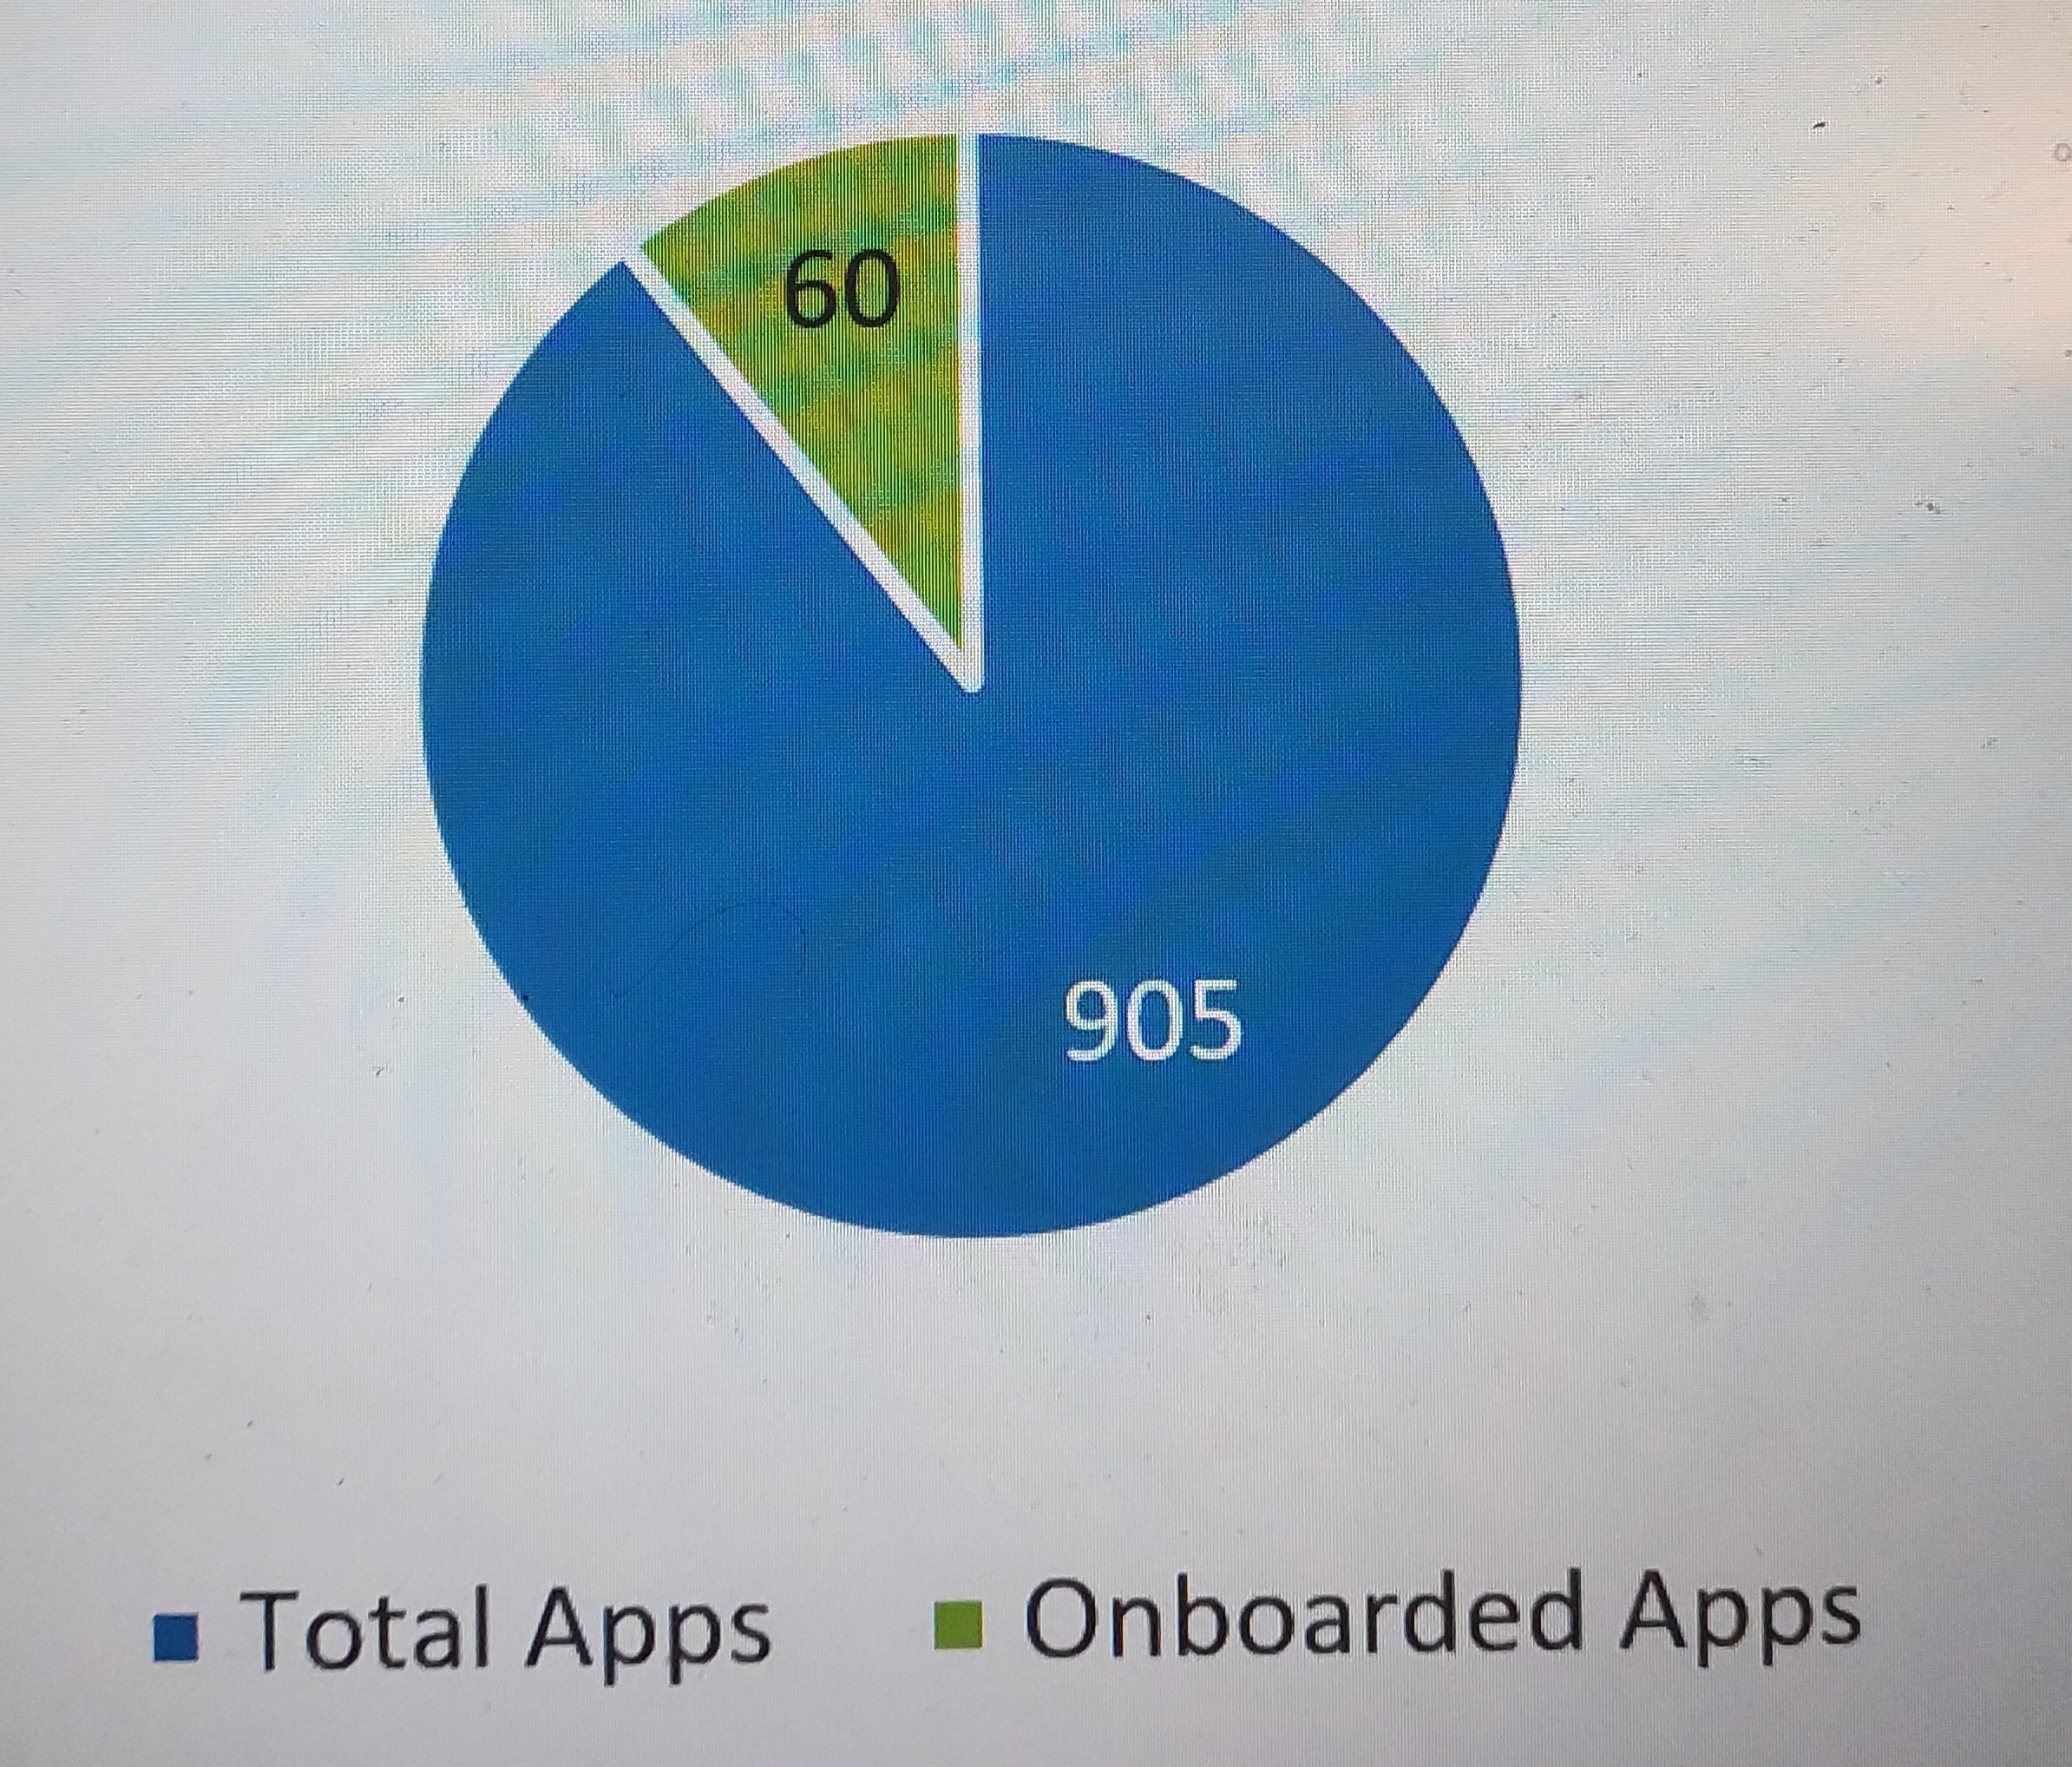
Numbers show up when you hover over each segment
- Mark as New
- Bookmark Message
- Subscribe to Message
- Mute Message
- Subscribe to RSS Feed
- Permalink
- Report Inappropriate Content
So where i can change the changes in the spl or xml source @
- Mark as New
- Bookmark Message
- Subscribe to Message
- Mute Message
- Subscribe to RSS Feed
- Permalink
- Report Inappropriate Content
What changes are you expecting - this is the way pie charts work - you could consider appending the value to the title
|rest /services/data/indexes
|rename title as index
|rex field=index "^foo_(?<appname>.+)"
|rex field=index "^foo_(?<appname>.+)_"
|table appname, index
|stats dc(appname) as count
|eval title = "currentapps: ".count
| append
[| makeresults
| eval count = 300
| eval title="total_apps: ".count]
| table title count
- Mark as New
- Bookmark Message
- Subscribe to Message
- Mute Message
- Subscribe to RSS Feed
- Permalink
- Report Inappropriate Content
- Mark as New
- Bookmark Message
- Subscribe to Message
- Mute Message
- Subscribe to RSS Feed
- Permalink
- Report Inappropriate Content
As you can see here, there are no configuration options for this feature
- Mark as New
- Bookmark Message
- Subscribe to Message
- Mute Message
- Subscribe to RSS Feed
- Permalink
- Report Inappropriate Content
1) yes, this is the first approach i have take, later i posted in the community. But why its not showing the value count over chart.
2) by the way @ITWhisperer if you have any idea please help me for this
https://community.splunk.com/t5/All-Apps-and-Add-ons/JSON-data-unexpected-value-count/m-p/677019#M80...
3)is it possible to remove the label name below colored where like "Mon Jan 15" to "Jan 15" like this. from UI or XML source or SPL

- Mark as New
- Bookmark Message
- Subscribe to Message
- Mute Message
- Subscribe to RSS Feed
- Permalink
- Report Inappropriate Content
1) already answered - standard pie charts don't have this feature in Splunk
2) responded in thread
3) edit your dashboard panel and change the x-axis title to none

- Mark as New
- Bookmark Message
- Subscribe to Message
- Mute Message
- Subscribe to RSS Feed
- Permalink
- Report Inappropriate Content
@ITWhisperer for this 3) edit your dashboard panel and change the x-axis title to none
I have found the solution to this issue. I applied the following SPL code to the existing SPL, and the visualization updated automatically to reflect the changes.
|timechart span=1d count
|eval Date=strftime(_time, "%m/%d")
|table Date, count
@ITWhisperer thanks for your time...
- Mark as New
- Bookmark Message
- Subscribe to Message
- Mute Message
- Subscribe to RSS Feed
- Permalink
- Report Inappropriate Content
It is not clear what result you are expecting - please can you expand your question
.conf24 | Day 0
Enhance Security Visibility with Splunk Enterprise Security 7.1 through Threat ...
Troubleshooting the OpenTelemetry Collector
