Are you a member of the Splunk Community?
- Find Answers
- :
- Using Splunk
- :
- Dashboards & Visualizations
- :
- Re: Single value with trellis have to show color b...
- Subscribe to RSS Feed
- Mark Topic as New
- Mark Topic as Read
- Float this Topic for Current User
- Bookmark Topic
- Subscribe to Topic
- Mute Topic
- Printer Friendly Page
- Mark as New
- Bookmark Message
- Subscribe to Message
- Mute Message
- Subscribe to RSS Feed
- Permalink
- Report Inappropriate Content
Single value with trellis have to show color based on field value
Hi Team,
Kindly help me with the below scenario.
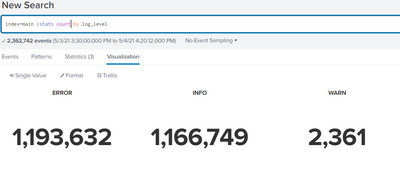
As shown in the diagram my query is index=main |stats count by log_level
I would like to show the background color for Error is red, Warn is Amber, Info is green. The color shouldn't depend on the values. Whatever the count it does not matter. when the panels should always show red for ERROR Warn is Amber, Info is green
Kindly help me on the same
Thanks & Regards,
Reddy
- Mark as New
- Bookmark Message
- Subscribe to Message
- Mute Message
- Subscribe to RSS Feed
- Permalink
- Report Inappropriate Content
- Mark as New
- Bookmark Message
- Subscribe to Message
- Mute Message
- Subscribe to RSS Feed
- Permalink
- Report Inappropriate Content
Hi Sajeev,
Thanks for the reply I don't want to be based on the value I am aware of that color option. but I need based on the Error, Info, Warn based on this I required the color. I hope you understand. If not please check the below screenshot. if it is the error I need red if it is the info I need Green if it is the warn need amber. Hope this will clear my question.
Thanks & Regards,
Balaji Reddy.
- Mark as New
- Bookmark Message
- Subscribe to Message
- Mute Message
- Subscribe to RSS Feed
- Permalink
- Report Inappropriate Content
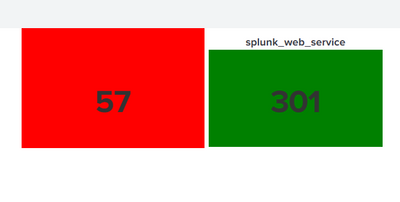
you want this right ?
Right mouse click on screen then click on inspect and and then check for the html tag where your value is, as you can see in below image there is a "id" in the div tag which is unique to my single value
and you can also see my id="singlevalue" which is the child of div tag which have id="facet-viz_groupby_field_sourcetype_groupby_value_splunk_web_service", you will also see something similar for your panel. Since id is unique, I can use this to change the background color. Then create a .css file(for e.g. color.css) in $SPLUNK_HOME/etc/apps/<your-app-name>/appserver/static. And in that CSS file write the following code:
1. if you want background like red one, then write:
#facet-viz_groupby_field_sourcetype_groupby_value_splunk_web_access{
background:red;
}
(here "#facet-viz_groupby_field_sourcetype_groupby_value_splunk_web_access" is the id you saw in above image"
2. if you want background like green one, then write:
#facet-viz_groupby_field_sourcetype_groupby_value_splunk_web_service>div#singlevalue{
background:green;
}
(here "div#singlevalue" is written to identify the child of "#facet-viz_groupby_field_sourcetype_groupby_value_splunk_web_service" )
If this help you, give an upvote
Thank you
- Mark as New
- Bookmark Message
- Subscribe to Message
- Mute Message
- Subscribe to RSS Feed
- Permalink
- Report Inappropriate Content
Hi Flash,
Thanks for the reply. But in my scenario all the 3 single value visualizations in same panel. I hope you understand what I am trying to say. if not please let me know will explain clearly.
Thanks & Regards,
Reddy.
- Mark as New
- Bookmark Message
- Subscribe to Message
- Mute Message
- Subscribe to RSS Feed
- Permalink
- Report Inappropriate Content
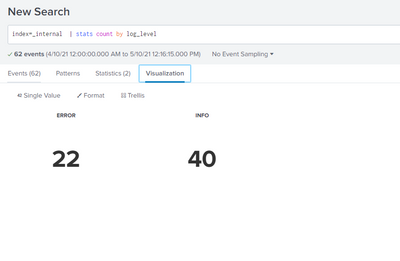
I have used trellis, and my search query was index=_internal | stats count by sourcetype
on the basis of that I have changed the background color as you can see in above reply.
you want to change the Background color as I have show right ?
if not then edit your screenshot in paint or any other s/w and tell what exactly you want and also mention the xml code , using some example which I can also perform and understand your situation better.
- Mark as New
- Bookmark Message
- Subscribe to Message
- Mute Message
- Subscribe to RSS Feed
- Permalink
- Report Inappropriate Content
Hi Thanks, this looks will work, But how this will apply specific to this dashboard and also is there any way easily use CSS from UI itself without doing changes in the backend?
- Mark as New
- Bookmark Message
- Subscribe to Message
- Mute Message
- Subscribe to RSS Feed
- Permalink
- Report Inappropriate Content
CSS can be added to the source of a simpleXML / classic dashboard (not Dashboard Studio). This is a very old post - you should start your own question which more specific information about your particular usecase so we can give you more targeted and relevant information.


