- Splunk Answers
- :
- Using Splunk
- :
- Dashboards & Visualizations
- :
- Select "All" option in dropdown doesnot work
- Subscribe to RSS Feed
- Mark Topic as New
- Mark Topic as Read
- Float this Topic for Current User
- Bookmark Topic
- Subscribe to Topic
- Mute Topic
- Printer Friendly Page
- Mark as New
- Bookmark Message
- Subscribe to Message
- Mute Message
- Subscribe to RSS Feed
- Permalink
- Report Inappropriate Content
Hi,
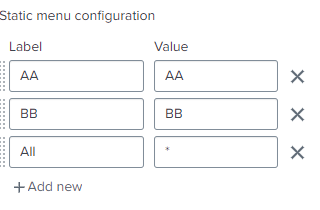
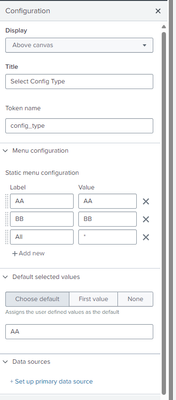
I have a simple dropdown with 3 options All, AA and BB. When I select AA/BB I am getting correct results however when I select "All" it says "No search results returned". Not sure where I am doing wrong, can anyone help me solving this issue.
"input_iUKfLZBh": {
            "options": {
                "items": [
                    {
                        "label": "AA",
                        "value": "AA"
                    },
                    {
                        "label": "BB",
                        "value": "BB"
                    },
                    {
                        "label": "All",
                        "value": "*"
                    }
                ],
                "token": "Config_type",
                "defaultValue": "AA"
            },
            "title": "Select Error Type",
            "type": "input.dropdown"
        }
- Mark as New
- Bookmark Message
- Subscribe to Message
- Mute Message
- Subscribe to RSS Feed
- Permalink
- Report Inappropriate Content
The where command doesn't support wildcards in the same way as search. Either change where to search or change the dropdown to include the whole command line apart from the "All" option where it should be blank.
- Mark as New
- Bookmark Message
- Subscribe to Message
- Mute Message
- Subscribe to RSS Feed
- Permalink
- Report Inappropriate Content
How are you using the token in your search?
- Mark as New
- Bookmark Message
- Subscribe to Message
- Mute Message
- Subscribe to RSS Feed
- Permalink
- Report Inappropriate Content
Thank you for replying.
I am using the token in the chain search.
- Mark as New
- Bookmark Message
- Subscribe to Message
- Mute Message
- Subscribe to RSS Feed
- Permalink
- Report Inappropriate Content
The where command doesn't support wildcards in the same way as search. Either change where to search or change the dropdown to include the whole command line apart from the "All" option where it should be blank.
- Mark as New
- Bookmark Message
- Subscribe to Message
- Mute Message
- Subscribe to RSS Feed
- Permalink
- Report Inappropriate Content
It worked, thank you so much!
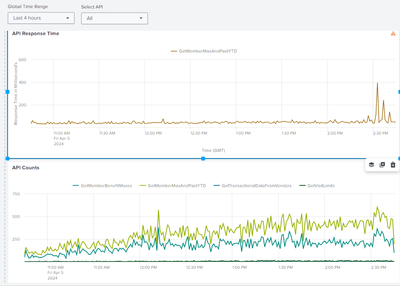
But I need one more help. I have another dashboard with a dropdown and two line graphs showing Response-Time and Counts. The base search used for both the graphs is exactly same however the chain search's are little different where one calculates the average response time and other calculates counts for the same. But the counts graph works perfectly however the response time only shows for one selection("All" is selected in dropdown). Please help me in finding the issue.
- Mark as New
- Bookmark Message
- Subscribe to Message
- Mute Message
- Subscribe to RSS Feed
- Permalink
- Report Inappropriate Content
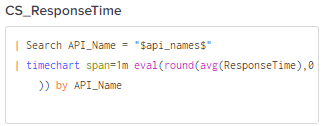
Try without the rounding
| timechart span=1m avg(ResponseTime) by API_Name- Mark as New
- Bookmark Message
- Subscribe to Message
- Mute Message
- Subscribe to RSS Feed
- Permalink
- Report Inappropriate Content
Hi, I have removed the round function in chain search but it is still showing the same graph.
- Mark as New
- Bookmark Message
- Subscribe to Message
- Mute Message
- Subscribe to RSS Feed
- Permalink
- Report Inappropriate Content
You have an orange triangle warning symbol in the top right of your chart. What does this message say?
- Mark as New
- Bookmark Message
- Subscribe to Message
- Mute Message
- Subscribe to RSS Feed
- Permalink
- Report Inappropriate Content
Warning: "This usually indicates problems with underlying storage performance."
But this warning is showing for other graph too.
- Mark as New
- Bookmark Message
- Subscribe to Message
- Mute Message
- Subscribe to RSS Feed
- Permalink
- Report Inappropriate Content
Try changing the timeframe for the search to a shorter time frame - does the graph work then?
- Mark as New
- Bookmark Message
- Subscribe to Message
- Mute Message
- Subscribe to RSS Feed
- Permalink
- Report Inappropriate Content
Yes, I have tried diff timeframes (Last 15minutes option too) but no luck. Actually, my agenda is to find the response time and counts for the same time frame. If we are seeing the counts then by default it should show the response time too.
But when I click on magnifying glass icon(open in search) in view mode it is giving results for other API's too.
- Mark as New
- Bookmark Message
- Subscribe to Message
- Mute Message
- Subscribe to RSS Feed
- Permalink
- Report Inappropriate Content
Does it work if you create two base searches rather than 1 base search and two chained searches?
- Mark as New
- Bookmark Message
- Subscribe to Message
- Mute Message
- Subscribe to RSS Feed
- Permalink
- Report Inappropriate Content
Another option you could try is converting the dashboard to Classic
- Mark as New
- Bookmark Message
- Subscribe to Message
- Mute Message
- Subscribe to RSS Feed
- Permalink
- Report Inappropriate Content
Hi, my issue got resolved. It's weird but I have tried changing different "Visualization Type" and to my surprise Line chart suddenly started populating graphs for all the options I have selected in the dropdown.
- Mark as New
- Bookmark Message
- Subscribe to Message
- Mute Message
- Subscribe to RSS Feed
- Permalink
- Report Inappropriate Content
Tried changing to different base search and it did not work. My dashboard has other graphs too so changing to classic is big task, but will sure give a try, Thank you!


