Are you a member of the Splunk Community?
- Find Answers
- :
- Using Splunk
- :
- Dashboards & Visualizations
- :
- Percentage - sum all values below 5% into a value ...
- Subscribe to RSS Feed
- Mark Topic as New
- Mark Topic as Read
- Float this Topic for Current User
- Bookmark Topic
- Subscribe to Topic
- Mute Topic
- Printer Friendly Page
- Mark as New
- Bookmark Message
- Subscribe to Message
- Mute Message
- Subscribe to RSS Feed
- Permalink
- Report Inappropriate Content
Hi Splunk gurus!
Our application exposes different services as APIs. All API traffic coming into the application is logged in Splunk.
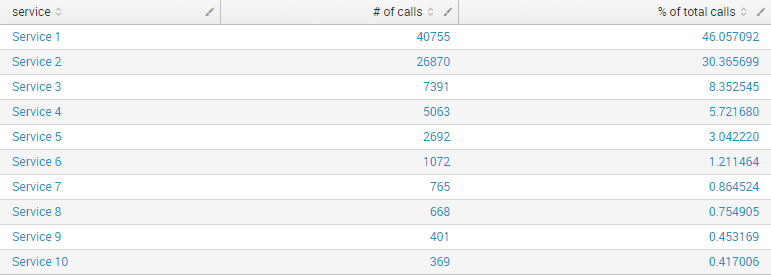
For reporting purposes, we display the total call volume in the format below.
using the query
index=something | top limit=100 service_name | sort by count desc | rename count as "# of calls", percent as "% of total calls"
The requirement now is to only show services which have call volume > 5%, but to summate all the remaining ones into a single row called 'Other'. So, the final output should be something like:
Need help on how to achieve this please.
Thanks
- Mark as New
- Bookmark Message
- Subscribe to Message
- Mute Message
- Subscribe to RSS Feed
- Permalink
- Report Inappropriate Content
Try this!
 index=something
| top limit=100 service_name
| eval service_name=if(percent>5,service_name,"Other")
| stats sum(count) as count,sum(percent) as percent by service_name
| sort by count desc
| rename count as "# of calls", percent as "% of total calls"
- Mark as New
- Bookmark Message
- Subscribe to Message
- Mute Message
- Subscribe to RSS Feed
- Permalink
- Report Inappropriate Content
If you're gonna group everything under 5% as "Other", then do you really want to limit to the top 100? Your percentage won't add up to 100%.
- Mark as New
- Bookmark Message
- Subscribe to Message
- Mute Message
- Subscribe to RSS Feed
- Permalink
- Report Inappropriate Content
@technie101, are you planning on using table or pie chart to show the results?
| makeresults | eval message= "Happy Splunking!!!"
- Mark as New
- Bookmark Message
- Subscribe to Message
- Mute Message
- Subscribe to RSS Feed
- Permalink
- Report Inappropriate Content
Hi technie101,
try something like this:
index=something
| eventstats count AS Total
| stats values(Total) AS Total count BY service_name
| eval perc=count/Total*100
| table service_name count perc
| eval service_name=if(perc>5,service_name,"Other")
| stats sum(count) AS count BY service_name
| sort by count desc
| rename count as "# of calls"
Bye.
Giuseppe
- Mark as New
- Bookmark Message
- Subscribe to Message
- Mute Message
- Subscribe to RSS Feed
- Permalink
- Report Inappropriate Content
@cusello, I would perform stats first and then eventstats to apply to limited services (~100 based on current query), rather than enriching all events with eventstats.
 index=something
| stats count by service_name
| eventstats sum(count) as Total
...
...
| makeresults | eval message= "Happy Splunking!!!"
- Mark as New
- Bookmark Message
- Subscribe to Message
- Mute Message
- Subscribe to RSS Feed
- Permalink
- Report Inappropriate Content
Try this!
 index=something
| top limit=100 service_name
| eval service_name=if(percent>5,service_name,"Other")
| stats sum(count) as count,sum(percent) as percent by service_name
| sort by count desc
| rename count as "# of calls", percent as "% of total calls"
- Mark as New
- Bookmark Message
- Subscribe to Message
- Mute Message
- Subscribe to RSS Feed
- Permalink
- Report Inappropriate Content
Thanks Hiroshi. I've accepeted the answer because the changes on top of what I was already using were minimal.
- Mark as New
- Bookmark Message
- Subscribe to Message
- Mute Message
- Subscribe to RSS Feed
- Permalink
- Report Inappropriate Content
Please be careful as it is truncated at the top 100.
| top limit=100 service_name
- Mark as New
- Bookmark Message
- Subscribe to Message
- Mute Message
- Subscribe to RSS Feed
- Permalink
- Report Inappropriate Content
@technie101, you should be comparing results (as stated by @HiroshiSatoh) and performance (using Job Inspector) with the queries posted as answers. You should choose the query which gives accurate results as per your need and also performs the best while executing.
| makeresults | eval message= "Happy Splunking!!!"
- Mark as New
- Bookmark Message
- Subscribe to Message
- Mute Message
- Subscribe to RSS Feed
- Permalink
- Report Inappropriate Content
Hey @technie101, Can you post your final search that utilized @HiroshiSatoh's answer? That would be great to see altogether for other users. I think it would be great to feature in the Smart Answers blog series as well. 🙂
- Mark as New
- Bookmark Message
- Subscribe to Message
- Mute Message
- Subscribe to RSS Feed
- Permalink
- Report Inappropriate Content
Hi @technie101,
Can you please try?
YOUR_FIRST_SEARCH
| eval srno=1
| accum srno | eval service=if(srno>5,"Other",service)
| stats sum("# of calls") as "# of calls" sum("% of total calls") as "% of total calls" by service
Change if condition as per your requirement "if(srno>5,"Other",service)".
Thanks


