- Splunk Answers
- :
- Using Splunk
- :
- Dashboards & Visualizations
- :
- PaloAlto Networks App- Dashboards partially show n...
- Subscribe to RSS Feed
- Mark Topic as New
- Mark Topic as Read
- Float this Topic for Current User
- Bookmark Topic
- Subscribe to Topic
- Mute Topic
- Printer Friendly Page
- Mark as New
- Bookmark Message
- Subscribe to Message
- Mute Message
- Subscribe to RSS Feed
- Permalink
- Report Inappropriate Content
PaloAlto Networks App- Dashboards partially show no data- improper node cfg in the app(?)
Hi guys,
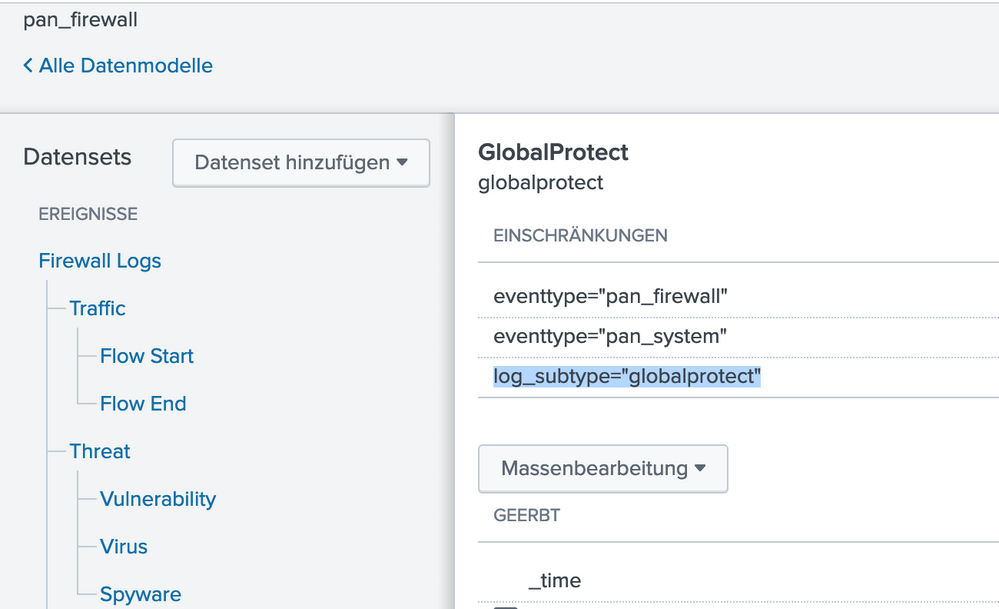
I have a a problem with the Splunk app for PaloAlto and have confirmed everything is properly set up, the syslog messages arrive at Splunk and I can search for them. Nevertheless some dashboards like global protect or user behavior are completely empty even though the data is there and is properly assigned. As example I have attached global protect, the following log entry can be found using search:
2019/01/22
13:18:35,12345678,SYSTEM,globalprotect,0,2019/01/22
13:18:35,,globalprotectgateway-logout-succ,GP-Gateway-N,0,0,general,informational,"GlobalProtect
gateway user logout succeeded. User
name: -, Client OS version: -, Reason:
user session
expired.",70946,0x0,0,0,0,0,,PA220
host = x.x.x.x log_subtype = globalprotect source = udp:514 sourcetype = pan:system
I have taken a look at the Palo Dashboards and it seems the query is looking at wrong nodes which do not exist (anymore) or the dataset variables must have changed at some point. In this case global protect_log cannot be found anywhere.
Am I missing something here or do we need an update? This could also be the explanation for the other dashboard not showing data, even tough all the data is there, pan:config - pan:data - pan:threat - pan:system - pan:traffic


