Join the Conversation
- Find Answers
- :
- Using Splunk
- :
- Dashboards & Visualizations
- :
- Not able to find sourcetype
- Subscribe to RSS Feed
- Mark Topic as New
- Mark Topic as Read
- Float this Topic for Current User
- Bookmark Topic
- Subscribe to Topic
- Mute Topic
- Printer Friendly Page
- Mark as New
- Bookmark Message
- Subscribe to Message
- Mute Message
- Subscribe to RSS Feed
- Permalink
- Report Inappropriate Content
Will i am seeing the events data is showing but there is sourcetype is missing for last 24 hours.
What could be the reason , how to check .
- Mark as New
- Bookmark Message
- Subscribe to Message
- Mute Message
- Subscribe to RSS Feed
- Permalink
- Report Inappropriate Content
Hi @Praz_123,
how do you read the logs? are they in a file?
if yes, check if in the file there are logs in the missing periods.
if not, the issue is outside Splunk.
If yes, your should check if they were writtend moment by moment or after a delay.
For this reason I hint to create an alert depending on the update frequency of your data (e.g. every 15 minutes).
So you can immediately check if the issue is in Splunk or outside it.
Ciao.
Giuseppe
- Mark as New
- Bookmark Message
- Subscribe to Message
- Mute Message
- Subscribe to RSS Feed
- Permalink
- Report Inappropriate Content
Hi @Praz_123,
if one sourcetype was present and noy it's missing, there could be two reasons:
- you modified the inputs.conf assigning the sourcetype to a data flow,
- the data flow stopped.
You can check the first choice viewing if someone modified the inputs.conf that should ingest data.
For the second choice you should analyze, if you're still receiving data and when the data stopped:
index=your_index sourcetype=your_sourcetype
| head 10
Ciao.
Giuseppe
- Mark as New
- Bookmark Message
- Subscribe to Message
- Mute Message
- Subscribe to RSS Feed
- Permalink
- Report Inappropriate Content
- Mark as New
- Bookmark Message
- Subscribe to Message
- Mute Message
- Subscribe to RSS Feed
- Permalink
- Report Inappropriate Content
Hi @Praz_123,
you should create an alert when data flow stopped and immediately see if there something that blocked it.
then, if the data flow arrives from text files, you could see if in the files there are data in the missing periods.
Ciao.
Giuseppe
- Mark as New
- Bookmark Message
- Subscribe to Message
- Mute Message
- Subscribe to RSS Feed
- Permalink
- Report Inappropriate Content
No Recent Logs Found for Source: abc:conf
No Splunk ingestion for Glo_Pa Alxt Ingestion found in the last 24 hours for:
Index: glo_pa_logs
SourceType: abc:conf
How to find in SSH or in UI
- Mark as New
- Bookmark Message
- Subscribe to Message
- Mute Message
- Subscribe to RSS Feed
- Permalink
- Report Inappropriate Content
Hi @Praz_123,
let me understand:
if you run this search:
index=glo_pa_logs sourceType=abc:conf in the last 24 hours, have you results?
have you results in the last 7 days?
running this search:
index=glo_pa_logs sourceType=abc:conf
| timechart span=1h count
what are the results?
Ciao.
Giuseppe
- Mark as New
- Bookmark Message
- Subscribe to Message
- Mute Message
- Subscribe to RSS Feed
- Permalink
- Report Inappropriate Content
@gcusello
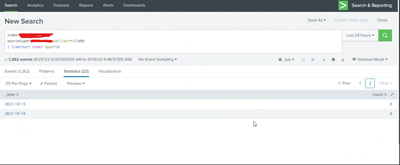
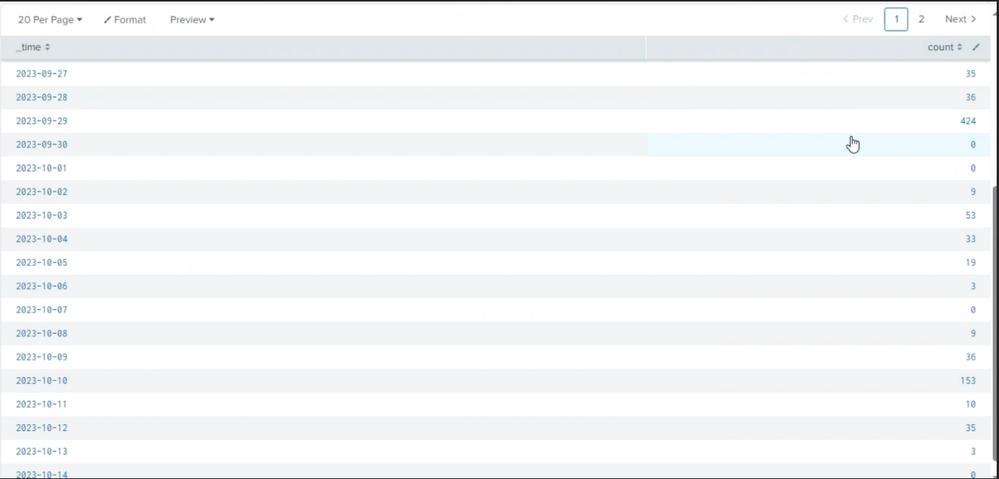
Have a look in the ss able to see the data for last few days but not for last 3 days ,how to check that what is happen to the data for last 3 days .
- Mark as New
- Bookmark Message
- Subscribe to Message
- Mute Message
- Subscribe to RSS Feed
- Permalink
- Report Inappropriate Content
Hi @Praz_123,
how do you read the logs? are they in a file?
if yes, check if in the file there are logs in the missing periods.
if not, the issue is outside Splunk.
If yes, your should check if they were writtend moment by moment or after a delay.
For this reason I hint to create an alert depending on the update frequency of your data (e.g. every 15 minutes).
So you can immediately check if the issue is in Splunk or outside it.
Ciao.
Giuseppe
- Mark as New
- Bookmark Message
- Subscribe to Message
- Mute Message
- Subscribe to RSS Feed
- Permalink
- Report Inappropriate Content
@gcusello
Thanks for support 🙂
- Mark as New
- Bookmark Message
- Subscribe to Message
- Mute Message
- Subscribe to RSS Feed
- Permalink
- Report Inappropriate Content
Hi @Praz_123 ,
good for you, see next time!
let me know if I can help you more, or, please, accept one answer for the other people of Community.
Ciao and happy splunking
Giuseppe
P.S.: Karma Points are appreciated 😉


