Are you a member of the Splunk Community?
- Find Answers
- :
- Using Splunk
- :
- Dashboards & Visualizations
- :
- Logarithmic y-axis on line graph in Dashboard Stud...
- Subscribe to RSS Feed
- Mark Topic as New
- Mark Topic as Read
- Float this Topic for Current User
- Bookmark Topic
- Subscribe to Topic
- Mute Topic
- Printer Friendly Page
- Mark as New
- Bookmark Message
- Subscribe to Message
- Mute Message
- Subscribe to RSS Feed
- Permalink
- Report Inappropriate Content
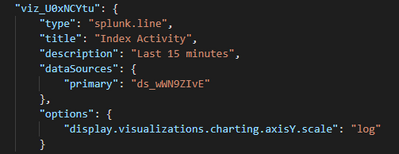
I'm trying to set up a logarithmic scale on my y-axis, and couldn't find anything that's relevant - the XML syntax doesn't match the dashboard editor, and I'm a bit confused.
I tried doing this, ripping the line from the properties of an identical search I ran with a logarithmic y-axis, but I'm not getting results.
Any help would be appreciated; thanks!
- Mark as New
- Bookmark Message
- Subscribe to Message
- Mute Message
- Subscribe to RSS Feed
- Permalink
- Report Inappropriate Content
The option name in Dashboard Studio is "yAxisScale". See https://docs.splunk.com/Documentation/SplunkCloud/9.0.2305/DashStudio/chartsArea#Source_options_for_...
If this reply helps you, Karma would be appreciated.
- Mark as New
- Bookmark Message
- Subscribe to Message
- Mute Message
- Subscribe to RSS Feed
- Permalink
- Report Inappropriate Content
This message is labeled "simple XML", but the screen shot appears to be from Dashboard Studio (JSON). Please clarify.
If this reply helps you, Karma would be appreciated.
- Mark as New
- Bookmark Message
- Subscribe to Message
- Mute Message
- Subscribe to RSS Feed
- Permalink
- Report Inappropriate Content
Cleared tag, apologies.

