Join the Conversation
- Find Answers
- :
- Using Splunk
- :
- Dashboards & Visualizations
- :
- Is there a way to create a chart where each date ...
- Subscribe to RSS Feed
- Mark Topic as New
- Mark Topic as Read
- Float this Topic for Current User
- Bookmark Topic
- Subscribe to Topic
- Mute Topic
- Printer Friendly Page
- Mark as New
- Bookmark Message
- Subscribe to Message
- Mute Message
- Subscribe to RSS Feed
- Permalink
- Report Inappropriate Content
I am trying to create a "monitoring" dashboard that compares the data count in a clients database to the count in our corporate database. For each Event Name (sourcetype) I have the following metrics: nVerifyEvents, nPropertyEvents, nReceivedEvents. I want to display all 3 metrics per Event Name per date for the last 7 days. Here is a screenshot of what I have so far.
Is there anyway to create a chart so it displays like this:
If this isn't possible, do any of you have some suggestions on a way to display this information on a dashboard? Should I do each date as a separate chart and put them on the same row in the dashboard? In my opinion it would be overkill to have the Event Name listed for each date but if that's the only way to go then it will have to work. I will also need to set up notifications if nReceivedEvents < nPropertyEvents so that we can address any missing data right away.
Thanks for any help or suggestions you send my way.
- Mark as New
- Bookmark Message
- Subscribe to Message
- Mute Message
- Subscribe to RSS Feed
- Permalink
- Report Inappropriate Content
Well done finding a solution. A couple of variants you could do would be
a) Make the validate field a multivalue field, so it renders a value per line rather than wrapping the values based on column width
| eval ValidationData=mvappend("nVerify=".nVerifyEvents,
                               "nProperty=".nPropertyEvents,
                               "nReceived=".nReceivedEvents,
                               "Missing=".Missing)
b) Make a labels column, so that the values are just under the dates, something like this
| makeresults
| eval n=mvrange(1,31)
| mvexpand n
| eval _time=now() - ((random() % 3 + 1) * 86400)
| fields - n
| eval eventName=mvindex(split("CustCkIn,CustCkOut,EduAssigned,EduView,FTGChannelOff",","),random() % 5)
| eval nVerifyEvents=random() % 20, nPropertyEvents=random() % 20, nReceivedEvents=random() % 20, nMissing=random() % 20
| bin _time span=1d
| stats sum(n*) as n* by _time eventName
| eval ValidationData=mvappend(nVerifyEvents,nPropertyEvents,nReceivedEvents,nMissing)
| eval date=strftime(_time, "%F")
| table date eventName ValidationData
| eval {date}=ValidationData
| fields - date ValidationData
| stats list(2*) as 2* by eventName
| eval Labels=mvappend("nVerify","nProperty","nReceived","Missing")
| fillnull value="Events Not Received"
| table eventName Labels 2*
- Mark as New
- Bookmark Message
- Subscribe to Message
- Mute Message
- Subscribe to RSS Feed
- Permalink
- Report Inappropriate Content
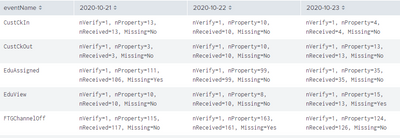
I ended up using an eval statement to combine the columns that would be under each date into a single column and then using other commands to get only one row each of the Event Names.
Here's the part of my query that I used to change the table to my desired look:
| eval ValidationData="nVerify="+nVerifyEvents+", "+"nProperty="+nPropertyEvents+", "+"nReceived="+nReceivedEvents+", "+"Missing="+Missing
| table date eventName ValidationData
| eval {date}=ValidationData
| fields - date ValidationData
| stats values(*) as * by eventName
| fillnull value="Events Not Received"
Here's a screenshot of the final result:
Not sure if this is the best way to do this but it works.
- Mark as New
- Bookmark Message
- Subscribe to Message
- Mute Message
- Subscribe to RSS Feed
- Permalink
- Report Inappropriate Content
Well done finding a solution. A couple of variants you could do would be
a) Make the validate field a multivalue field, so it renders a value per line rather than wrapping the values based on column width
| eval ValidationData=mvappend("nVerify=".nVerifyEvents,
                               "nProperty=".nPropertyEvents,
                               "nReceived=".nReceivedEvents,
                               "Missing=".Missing)
b) Make a labels column, so that the values are just under the dates, something like this
| makeresults
| eval n=mvrange(1,31)
| mvexpand n
| eval _time=now() - ((random() % 3 + 1) * 86400)
| fields - n
| eval eventName=mvindex(split("CustCkIn,CustCkOut,EduAssigned,EduView,FTGChannelOff",","),random() % 5)
| eval nVerifyEvents=random() % 20, nPropertyEvents=random() % 20, nReceivedEvents=random() % 20, nMissing=random() % 20
| bin _time span=1d
| stats sum(n*) as n* by _time eventName
| eval ValidationData=mvappend(nVerifyEvents,nPropertyEvents,nReceivedEvents,nMissing)
| eval date=strftime(_time, "%F")
| table date eventName ValidationData
| eval {date}=ValidationData
| fields - date ValidationData
| stats list(2*) as 2* by eventName
| eval Labels=mvappend("nVerify","nProperty","nReceived","Missing")
| fillnull value="Events Not Received"
| table eventName Labels 2*
- Mark as New
- Bookmark Message
- Subscribe to Message
- Mute Message
- Subscribe to RSS Feed
- Permalink
- Report Inappropriate Content
Sorry for the delay in response, I had to focus on another project for a couple days. LOL. But I did incorporate part a) and I really like the way the output looks. This will allow me to display a larger time range.
I haven't had time to go through your suggestion in part b) but have saved in for future exploration.


