Are you a member of the Splunk Community?
- Find Answers
- :
- Using Splunk
- :
- Dashboards & Visualizations
- :
- Re: Is it possible to have a dashboard panel expan...
- Subscribe to RSS Feed
- Mark Topic as New
- Mark Topic as Read
- Float this Topic for Current User
- Bookmark Topic
- Subscribe to Topic
- Mute Topic
- Printer Friendly Page
- Mark as New
- Bookmark Message
- Subscribe to Message
- Mute Message
- Subscribe to RSS Feed
- Permalink
- Report Inappropriate Content
- Mark as New
- Bookmark Message
- Subscribe to Message
- Mute Message
- Subscribe to RSS Feed
- Permalink
- Report Inappropriate Content
Hi mrfredman,
This is not possible because, Splunk identifies rows as major breaks , so you can't expand a panel across two or more than three rows.
- Mark as New
- Bookmark Message
- Subscribe to Message
- Mute Message
- Subscribe to RSS Feed
- Permalink
- Report Inappropriate Content
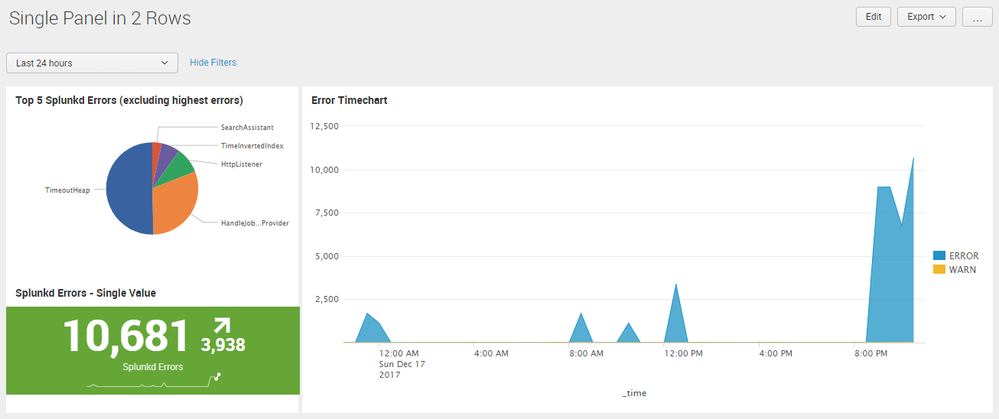
@mrfredman, until the time this feature is released as @woodcock has mentioned, you can use CSS and HTML to design dashboard layout as per your needs, through Simple XML CSS Extension.
I have attached a sample dashboard with CSS override example. However, CSS would be based on need. I have added id to all panel and the first pie chart to override CSS easily with id selectors.
  <row depends="$alwaysHideCSS$">
    <panel>
      <html>
        <style>
          <!-- Panel1 and Panel3 to occupy 30% width -->
          #panel1.dashboard-cell.dashboard-layout-panel{
            width: 30% !important;
          }

          #panel3.dashboard-cell.dashboard-layout-panel{
            width: 30% !important;
          }
          <!-- Panel2 to occupy 70% width -->
          #panel2.dashboard-cell.dashboard-layout-panel{
            width: 70% !important;
          }
          <!-- Panel1 reduced to occupy half the height of Panel1-->
          #chart1 #pie.viz-controller
          {
            height: 50% !important;
          }
          <!-- Panel3 manual override to fit in 50% space created in Panel1-->
          #panel3 .panel-element-row
          {
              position: absolute !important;
              width: 99.3% !important;
              top: -180px !important;
          }
        </style>
       </html>
    </panel>
  </row>
Following is the complete run anywhere dashboard Simple XML code for reference:
<form>
  <label>Single Panel in 2 Rows</label>
  <fieldset submitButton="false">
    <input type="time" token="field1">
      <label></label>
      <default>
        <earliest>-24h@h</earliest>
        <latest>now</latest>
      </default>
    </input>
  </fieldset>
  <row depends="$alwaysHideCSS$">
    <panel>
      <html>
        <style>
          <!-- Panel1 and Panel3 to occupy 30% width -->
          #panel1.dashboard-cell.dashboard-layout-panel{
            width: 30% !important;
          }

          #panel3.dashboard-cell.dashboard-layout-panel{
            width: 30% !important;
          }
          <!-- Panel2 to occupy 70% width -->
          #panel2.dashboard-cell.dashboard-layout-panel{
            width: 70% !important;
          }
          <!-- Panel1 reduced to occupy half the height of Panel1-->
          #chart1 #pie.viz-controller
          {
            height: 50% !important;
          }
          <!-- Panel3 manual override to fit in 50% space created in Panel1-->
          #panel3 .panel-element-row
          {
              position: absolute !important;
              width: 99.3% !important;
              top: -180px !important;
          }
        </style>
      </html>
    </panel>
  </row>
  <row>
    <panel id="panel1">
      <chart id="chart1">
        <title>Top 5 Splunkd Errors (excluding highest errors)</title>
        <search>
          <query>index=_internal sourcetype=splunkd log_level!="INFO"
| top 6 component showperc=f
| tail 5</query>
          <earliest>$field1.earliest$</earliest>
          <latest>$field1.latest$</latest>
        </search>
        <option name="charting.chart">pie</option>
        <option name="charting.drilldown">none</option>
        <option name="height">388</option>
        <option name="refresh.display">progressbar</option>
      </chart>
    </panel>
    <panel id="panel2">
      <chart>
        <title>Error Timechart</title>
        <search>
          <query>index=_internal sourcetype=splunkd log_level!="INFO"
| timechart count by log_level</query>
          <earliest>$field1.earliest$</earliest>
          <latest>$field1.latest$</latest>
        </search>
        <option name="charting.chart">area</option>
        <option name="charting.chart.stackMode">stacked</option>
        <option name="charting.drilldown">all</option>
        <option name="height">390</option>
        <option name="refresh.display">progressbar</option>
      </chart>
    </panel>
  </row>
  <row>
    <panel id="panel3">
      <single>
        <title>Splunkd Errors - Single Value</title>
        <search>
          <query>index=_internal sourcetype=splunkd log_level!="INFO"
| timechart count</query>
          <earliest>$field1.earliest$</earliest>
          <latest>$field1.latest$</latest>
        </search>
        <option name="colorBy">trend</option>
        <option name="colorMode">block</option>
        <option name="drilldown">none</option>
        <option name="refresh.display">progressbar</option>
        <option name="underLabel">Splunkd Errors</option>
        <option name="useColors">1</option>
      </single>
    </panel>
  </row>
</form>
| makeresults | eval message= "Happy Splunking!!!"
- Mark as New
- Bookmark Message
- Subscribe to Message
- Mute Message
- Subscribe to RSS Feed
- Permalink
- Report Inappropriate Content
Hi niketnilay, thanks so much. Just the sample code that I needed to experiment for my work.
- Mark as New
- Bookmark Message
- Subscribe to Message
- Mute Message
- Subscribe to RSS Feed
- Permalink
- Report Inappropriate Content
Splunk has an update to the Dashboard design that will allow this kind of thing but I have no idea if they are going to be releasing it or when. You should open an ER case so that you can get the details on that feature.
- Mark as New
- Bookmark Message
- Subscribe to Message
- Mute Message
- Subscribe to RSS Feed
- Permalink
- Report Inappropriate Content
Hi mrfredman,
This is not possible because, Splunk identifies rows as major breaks , so you can't expand a panel across two or more than three rows.
- Mark as New
- Bookmark Message
- Subscribe to Message
- Mute Message
- Subscribe to RSS Feed
- Permalink
- Report Inappropriate Content
hi
it is not possible because rows are based on horizontales to function.

