Are you a member of the Splunk Community?
- Find Answers
- :
- Using Splunk
- :
- Dashboards & Visualizations
- :
- Re: How to show "0" when a single value component ...
- Subscribe to RSS Feed
- Mark Topic as New
- Mark Topic as Read
- Float this Topic for Current User
- Bookmark Topic
- Subscribe to Topic
- Mute Topic
- Printer Friendly Page
- Mark as New
- Bookmark Message
- Subscribe to Message
- Mute Message
- Subscribe to RSS Feed
- Permalink
- Report Inappropriate Content
Hello
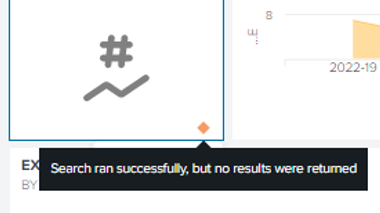
I'm using the new dashboard studio, and have a couple of single value and single value + trending components. I want these to show a "0" when no results are available for a given component instead of the default icon:
the single value has a |timechart count at the end and shows results when available, however it shows the default when no results are available and is something I want to fix, to make it clearer to the user.
While I tried with |fillnull , |fillnull value=0 count and even adding "shouldSparklineAcceptNullData":true in the code section for that single value, nothing seems to address this problem.
Any idea how can I have a 0 showing ? I have read multiple questions around the same topic, however no of the answers I found seems to work for me sadly.
Thanks in advance for any help this awesome community can provide.
- Mark as New
- Bookmark Message
- Subscribe to Message
- Mute Message
- Subscribe to RSS Feed
- Permalink
- Report Inappropriate Content
Hi @pstamati,
if you search using Google or the Community, there are many answers about this topic.
Anyway, you have to add at the end of your search
| appendpipe [stats count | where count=0]Ciao.
Giuseppe
- Mark as New
- Bookmark Message
- Subscribe to Message
- Mute Message
- Subscribe to RSS Feed
- Permalink
- Report Inappropriate Content
I certainly google it and tried a lot of answers but none of them worked. In any case, thanks as yours did work!
- Mark as New
- Bookmark Message
- Subscribe to Message
- Mute Message
- Subscribe to RSS Feed
- Permalink
- Report Inappropriate Content
Hi @pstamati,
good for you, see next time!
Ciao and happy splunking
Giuseppe
P.S.: Karma Points are appreciated 😉

