Are you a member of the Splunk Community?
- Find Answers
- :
- Using Splunk
- :
- Dashboards & Visualizations
- :
- How to set an image for background in Splunk dashb...
- Subscribe to RSS Feed
- Mark Topic as New
- Mark Topic as Read
- Float this Topic for Current User
- Bookmark Topic
- Subscribe to Topic
- Mute Topic
- Printer Friendly Page
- Mark as New
- Bookmark Message
- Subscribe to Message
- Mute Message
- Subscribe to RSS Feed
- Permalink
- Report Inappropriate Content
Hi guys,
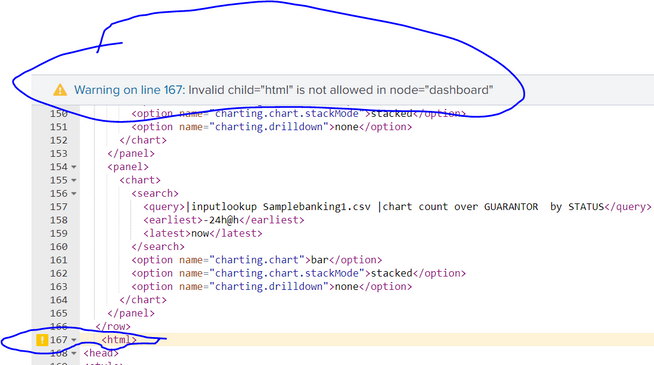
i want to add an image in background of Splunk dashboard and i am trying with html code but i am getting below error while adding in source code. Please try to help,
below is my code which i used,
<dashboard version="1.1">
<label>VLS_Customer Dashboard</label>
<row>
<panel>
<chart>
<search>
<query>|inputlookup Samplebanking1.csv |stats count by "DEPARTMENT CODE"</query>
<earliest>0</earliest>
<latest></latest>
</search>
<option name="charting.chart">column</option>
<option name="charting.chart.showDataLabels">all</option>
<option name="charting.chart.stackMode">default</option>
<option name="charting.drilldown">none</option>
<option name="refresh.display">progressbar</option>
</chart>
</panel>
<panel>
<chart>
<search>
<query>|inputlookup Samplebanking1.csv |stats count by STATUS</query>
<earliest>-30m@m</earliest>
<latest>now</latest>
<sampleRatio>1</sampleRatio>
</search>
<option name="charting.axisLabelsX.majorLabelStyle.overflowMode">ellipsisNone</option>
<option name="charting.axisLabelsX.majorLabelStyle.rotation">0</option>
<option name="charting.axisTitleX.visibility">visible</option>
<option name="charting.axisTitleY.visibility">visible</option>
<option name="charting.axisTitleY2.visibility">visible</option>
<option name="charting.axisX.abbreviation">none</option>
<option name="charting.axisX.scale">linear</option>
<option name="charting.axisY.abbreviation">none</option>
<option name="charting.axisY.scale">linear</option>
<option name="charting.axisY2.abbreviation">none</option>
<option name="charting.axisY2.enabled">0</option>
<option name="charting.axisY2.scale">inherit</option>
<option name="charting.chart">column</option>
<option name="charting.chart.bubbleMaximumSize">50</option>
<option name="charting.chart.bubbleMinimumSize">10</option>
<option name="charting.chart.bubbleSizeBy">area</option>
<option name="charting.chart.nullValueMode">gaps</option>
<option name="charting.chart.showDataLabels">minmax</option>
<option name="charting.chart.sliceCollapsingThreshold">0.01</option>
<option name="charting.chart.stackMode">default</option>
<option name="charting.chart.style">shiny</option>
<option name="charting.drilldown">none</option>
<option name="charting.layout.splitSeries">0</option>
<option name="charting.layout.splitSeries.allowIndependentYRanges">0</option>
<option name="charting.legend.labelStyle.overflowMode">ellipsisMiddle</option>
<option name="charting.legend.mode">standard</option>
<option name="charting.legend.placement">right</option>
<option name="charting.lineWidth">2</option>
<option name="trellis.enabled">0</option>
<option name="trellis.scales.shared">1</option>
<option name="trellis.size">medium</option>
</chart>
</panel>
</row>
<row>
<panel>
<table>
<search>
<query>|inputlookup Samplebanking1.csv |table "CUSTOMER ID" NAME COUNTRY STATUS LENDER BORROWER BENEFICIARY GUARANTOR "DEPARTMENT CODE" "EXPENSE CODE" "BRANCH CODE"</query>
<earliest>0</earliest>
<latest></latest>
</search>
<option name="drilldown">none</option>
<option name="refresh.display">progressbar</option>
</table>
</panel>
</row>
<row>
<panel>
<chart>
<search>
<query>|inputlookup Samplebanking1.csv |stats count by STATUS BORROWER LENDER GUARANTOR BENEFICIARY COUNTRY</query>
<earliest>-30m@m</earliest>
<latest>now</latest>
<sampleRatio>1</sampleRatio>
</search>
<option name="charting.axisLabelsX.majorLabelStyle.overflowMode">ellipsisNone</option>
<option name="charting.axisLabelsX.majorLabelStyle.rotation">0</option>
<option name="charting.axisTitleX.visibility">visible</option>
<option name="charting.axisTitleY.visibility">visible</option>
<option name="charting.axisTitleY2.visibility">visible</option>
<option name="charting.axisX.abbreviation">none</option>
<option name="charting.axisX.scale">linear</option>
<option name="charting.axisY.abbreviation">none</option>
<option name="charting.axisY.scale">linear</option>
<option name="charting.axisY2.abbreviation">none</option>
<option name="charting.axisY2.enabled">0</option>
<option name="charting.axisY2.scale">inherit</option>
<option name="charting.chart">bar</option>
<option name="charting.chart.bubbleMaximumSize">50</option>
<option name="charting.chart.bubbleMinimumSize">10</option>
<option name="charting.chart.bubbleSizeBy">area</option>
<option name="charting.chart.nullValueMode">gaps</option>
<option name="charting.chart.overlayFields">STATUS</option>
<option name="charting.chart.showDataLabels">none</option>
<option name="charting.chart.sliceCollapsingThreshold">0.01</option>
<option name="charting.chart.stackMode">stacked</option>
<option name="charting.chart.style">shiny</option>
<option name="charting.drilldown">none</option>
<option name="charting.layout.splitSeries">0</option>
<option name="charting.layout.splitSeries.allowIndependentYRanges">0</option>
<option name="charting.legend.labelStyle.overflowMode">ellipsisMiddle</option>
<option name="charting.legend.mode">standard</option>
<option name="charting.legend.placement">right</option>
<option name="charting.lineWidth">2</option>
<option name="trellis.enabled">0</option>
<option name="trellis.scales.shared">1</option>
<option name="trellis.size">medium</option>
</chart>
</panel>
</row>
<row>
<panel>
<chart>
<search>
<query>|inputlookup Samplebanking1.csv |chart count over BORROWER by STATUS</query>
<earliest>-24h@h</earliest>
<latest>now</latest>
</search>
<option name="charting.chart">bar</option>
<option name="charting.chart.stackMode">stacked</option>
<option name="charting.drilldown">none</option>
</chart>
</panel>
<panel>
<chart>
<search>
<query>|inputlookup Samplebanking1.csv |chart count over BENEFICIARY by STATUS</query>
<earliest>-24h@h</earliest>
<latest>now</latest>
</search>
<option name="charting.chart">bar</option>
<option name="charting.chart.stackMode">stacked</option>
<option name="charting.drilldown">none</option>
</chart>
</panel>
<panel>
<chart>
<search>
<query>|inputlookup Samplebanking1.csv |chart count over LENDER by STATUS</query>
<earliest>-24h@h</earliest>
<latest>now</latest>
</search>
<option name="charting.chart">bar</option>
<option name="charting.chart.stackMode">stacked</option>
<option name="charting.drilldown">none</option>
</chart>
</panel>
<panel>
<chart>
<search>
<query>|inputlookup Samplebanking1.csv |chart count over GUARANTOR by STATUS</query>
<earliest>-24h@h</earliest>
<latest>now</latest>
</search>
<option name="charting.chart">bar</option>
<option name="charting.chart.stackMode">stacked</option>
<option name="charting.drilldown">none</option>
</chart>
</panel>
</row>
<html>
<head>
<style>
body {
background-image: url('"C:\Users\narendra.jyeshta\Downloads\Splunk image.png"');
}
</style>
</head>
<body>
<h2>Background Image</h2>
<p>By default, the background image will repeat itself if it is smaller than the element where it is specified, in this case the body element.</p>
</body>
</html>
</dashboard>
- Mark as New
- Bookmark Message
- Subscribe to Message
- Mute Message
- Subscribe to RSS Feed
- Permalink
- Report Inappropriate Content
<html> block has to be in a <panel> block which in turn has to be in a <row> block or in a <fieldset> block
- Mark as New
- Bookmark Message
- Subscribe to Message
- Mute Message
- Subscribe to RSS Feed
- Permalink
- Report Inappropriate Content
<html> block has to be in a <panel> block which in turn has to be in a <row> block or in a <fieldset> block
- Mark as New
- Bookmark Message
- Subscribe to Message
- Mute Message
- Subscribe to RSS Feed
- Permalink
- Report Inappropriate Content
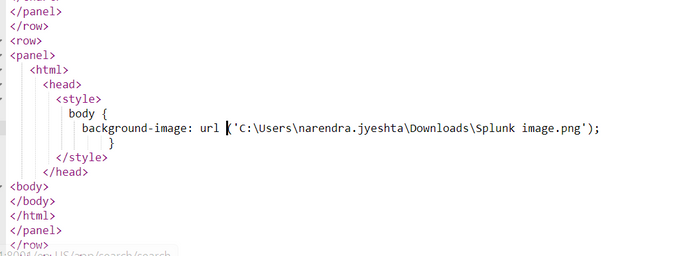
Thanks for your solution, it worked for rectifying error. But image is not displaying in Dashboard, can you please check is there any mistake in my code. Please see the below screenshot for your reference,
- Mark as New
- Bookmark Message
- Subscribe to Message
- Mute Message
- Subscribe to RSS Feed
- Permalink
- Report Inappropriate Content
Does the image file exist on your splunk server?
- Mark as New
- Bookmark Message
- Subscribe to Message
- Mute Message
- Subscribe to RSS Feed
- Permalink
- Report Inappropriate Content
yes,
can you please tell me the steps how to place an image in Background completely in Dashboard. I checked many sources but not working as expected. The image should be like a wallpaper like in mobile, please help me to complete this.
- Mark as New
- Bookmark Message
- Subscribe to Message
- Mute Message
- Subscribe to RSS Feed
- Permalink
- Report Inappropriate Content
Hi @Narendra045,
did you explored the sample in the Splunk Dashboard Examples App (https://splunkbase.splunk.com/app/1603/) ?
There an example as you need "Image Overlay with Single Values".
ciao.
Giuseppe


