
Join the Conversation
- Find Answers
- :
- Using Splunk
- :
- Dashboards & Visualizations
- :
- Re: How to reset or hide a drilldown panel
- Subscribe to RSS Feed
- Mark Topic as New
- Mark Topic as Read
- Float this Topic for Current User
- Bookmark Topic
- Subscribe to Topic
- Mute Topic
- Printer Friendly Page
- Mark as New
- Bookmark Message
- Subscribe to Message
- Mute Message
- Subscribe to RSS Feed
- Permalink
- Report Inappropriate Content
How to reset or hide a drilldown panel

Hi everyone,
I need some help here.
I have a panel with a pie chart and it has a drilldown panel.
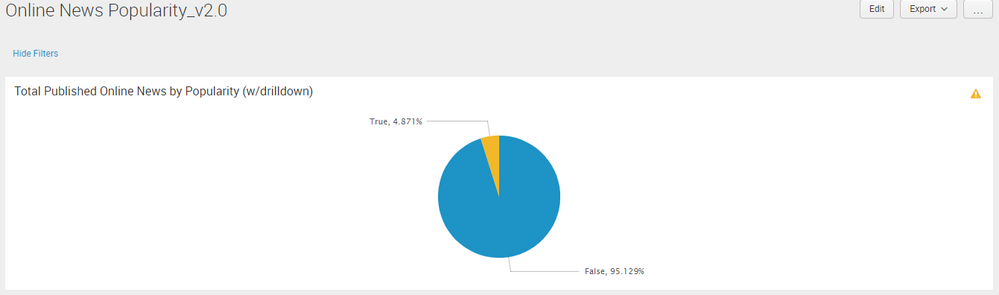
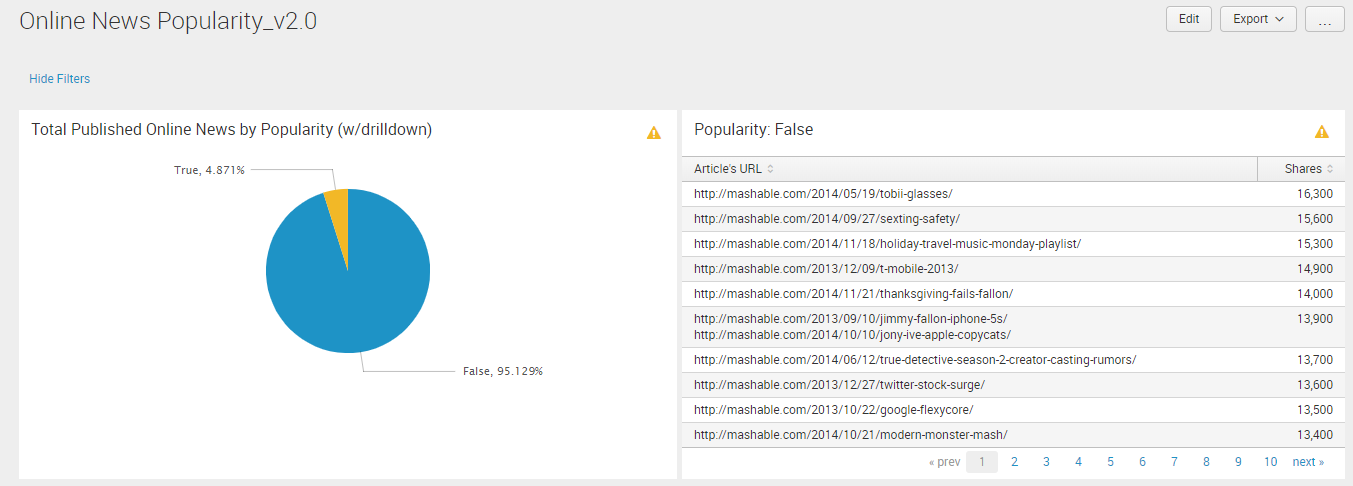
When the pie chart is clicked, the drilldown panel shows.
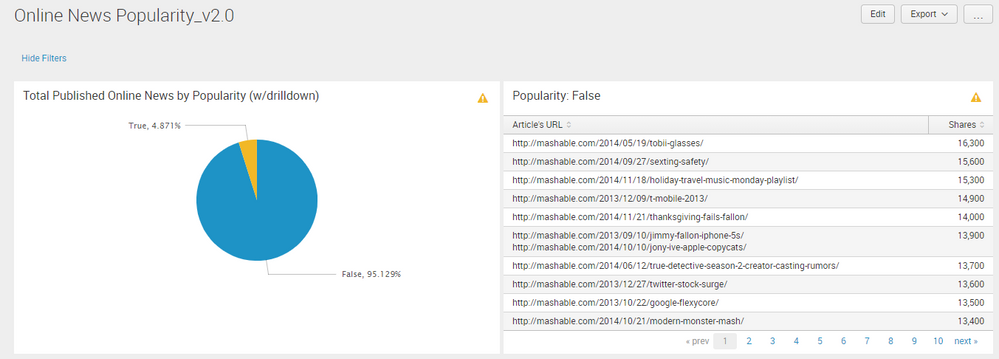
Now what I want to happen is that the user can reset or hide the drilldown panel when it is not needed anymore.
How is it possible?
Thanks in advance.
- Mark as New
- Bookmark Message
- Subscribe to Message
- Mute Message
- Subscribe to RSS Feed
- Permalink
- Report Inappropriate Content

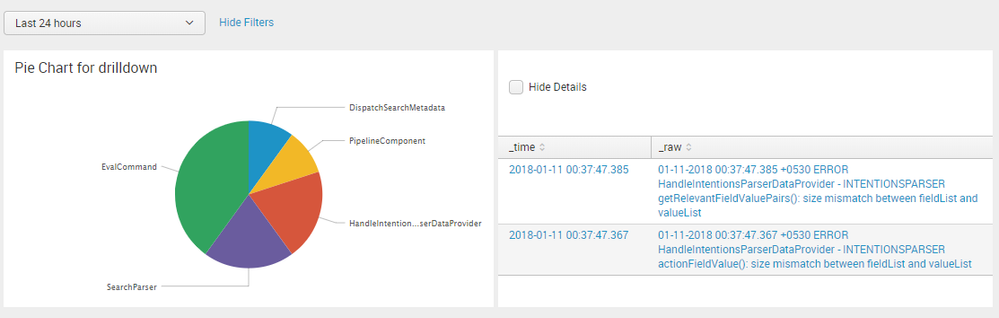
@jvmerilla, try the following run anywhere example based on Splunk's _internal index.
On click of a slice in Pie chart it displays the details table which has a Hide Details checkbox to be checked to reset the drilldown component and click on some other slice.

PS: If you need to show a button instead of check box you may use HTML button added to dashboard and unset token event coded using JavaScript extension to Simple XML. Refer to the following example: https://answers.splunk.com/answers/581652/how-can-i-create-a-button-switcher.html
Following is the run anywhere Simple XML dashboard example for the screenshot attached (please try out and confirm):
<form>
  <label>Reset Drilldown</label>
  <fieldset submitButton="false">
    <input type="time" token="tokTime" searchWhenChanged="true">
      <label></label>
      <default>
        <earliest>-24h@h</earliest>
        <latest>now</latest>
      </default>
    </input>
  </fieldset>
  <row>
    <panel>
      <title>Pie Chart for drilldown</title>
      <chart>
        <search>
          <query>index=_internal sourcetype=splunkd log_level!="INFO"
| rare 5 component</query>
          <earliest>$tokTime.earliest$</earliest>
          <latest>$tokTime.latest$</latest>
          <sampleRatio>1</sampleRatio>
        </search>
        <option name="charting.axisLabelsX.majorLabelStyle.overflowMode">ellipsisNone</option>
        <option name="charting.axisLabelsX.majorLabelStyle.rotation">0</option>
        <option name="charting.axisTitleX.visibility">visible</option>
        <option name="charting.axisTitleY.visibility">visible</option>
        <option name="charting.axisTitleY2.visibility">visible</option>
        <option name="charting.axisX.abbreviation">none</option>
        <option name="charting.axisX.scale">linear</option>
        <option name="charting.axisY.abbreviation">none</option>
        <option name="charting.axisY.scale">linear</option>
        <option name="charting.axisY2.abbreviation">none</option>
        <option name="charting.axisY2.enabled">0</option>
        <option name="charting.axisY2.scale">inherit</option>
        <option name="charting.chart">pie</option>
        <option name="charting.chart.bubbleMaximumSize">50</option>
        <option name="charting.chart.bubbleMinimumSize">10</option>
        <option name="charting.chart.bubbleSizeBy">area</option>
        <option name="charting.chart.nullValueMode">gaps</option>
        <option name="charting.chart.showDataLabels">none</option>
        <option name="charting.chart.sliceCollapsingThreshold">0.01</option>
        <option name="charting.chart.stackMode">default</option>
        <option name="charting.chart.style">shiny</option>
        <option name="charting.drilldown">all</option>
        <option name="charting.layout.splitSeries">0</option>
        <option name="charting.layout.splitSeries.allowIndependentYRanges">0</option>
        <option name="charting.legend.labelStyle.overflowMode">ellipsisMiddle</option>
        <option name="charting.legend.mode">standard</option>
        <option name="charting.legend.placement">right</option>
        <option name="charting.lineWidth">2</option>
        <option name="refresh.display">progressbar</option>
        <option name="trellis.enabled">0</option>
        <option name="trellis.scales.shared">1</option>
        <option name="trellis.size">medium</option>
        <drilldown>
          <set token="tokComponent">$click.value$</set>
        </drilldown>
      </chart>
    </panel>
    <panel depends="$tokComponent$">
      <input type="checkbox" token="tokReset" searchWhenChanged="true">
        <label></label>
        <change>
          <unset token="tokComponent"></unset>
          <unset token="form.tokReset"></unset>
        </change>
        <choice value="hide">Hide Details</choice>
        <delimiter> </delimiter>
      </input>
      <table>
        <search>
          <query>index=_internal sourcetype=splunkd log_level!="INFO" component="$tokComponent$"
| head 10
| table _time _raw</query>
          <earliest>$tokTime.earliest$</earliest>
          <latest>$tokTime.latest$</latest>
        </search>
        <option name="count">10</option>
        <option name="refresh.display">progressbar</option>
      </table>
    </panel>
  </row>
</form>
| makeresults | eval message= "Happy Splunking!!!"

- Mark as New
- Bookmark Message
- Subscribe to Message
- Mute Message
- Subscribe to RSS Feed
- Permalink
- Report Inappropriate Content
big tks!! this worked fro me.
- Mark as New
- Bookmark Message
- Subscribe to Message
- Mute Message
- Subscribe to RSS Feed
- Permalink
- Report Inappropriate Content

add the html section to your dashboard. it will only show when the popularity token is set and will unset the token when the Reset Drilldown button is clicked
    ...</drilldown>
         </chart>
         </panel>
<panel>
     <html depends="$popularity$">
             <button class="btn" data-unset-token="popularity">Reset Drilldown</button>
        </html>
        <title>Popularity: $popularity$</title>
       <table depends="$popularity$">
       <search>
             <query>index="online_news"...
- Mark as New
- Bookmark Message
- Subscribe to Message
- Mute Message
- Subscribe to RSS Feed
- Permalink
- Report Inappropriate Content

hey
have a look at this answer
https://answers.splunk.com/answers/559648/clear-or-hide-old-drilldown-panel-results-from-new.html
https://answers.splunk.com/answers/74959/hide-contract-the-drilldown-table.html
Let me know if this helps!
- Mark as New
- Bookmark Message
- Subscribe to Message
- Mute Message
- Subscribe to RSS Feed
- Permalink
- Report Inappropriate Content
Here is my code on this dashboard:
<form>
  <label>Online News Popularity_v2.0</label>
  <fieldset submitButton="false" autoRun="false">
    <input type="text" token="popularity" searchWhenChanged="true" depends="$hidden$">
      <label>Popularity</label>
    </input>
  </fieldset>

  <row>
    <panel>
      <title>Total Published Online News by Popularity (w/drilldown)</title>
      <chart>
        <search>
          <query>index="online_news"
| apply "online_news_popularity" as predicted_popularity
| stats count by predicted_popularity</query>
          <earliest>0</earliest>
          <latest></latest>
          <sampleRatio>1</sampleRatio>
        </search>
        <option name="charting.axisLabelsX.majorLabelStyle.overflowMode">ellipsisNone</option>
        <option name="charting.axisLabelsX.majorLabelStyle.rotation">0</option>
        <option name="charting.axisTitleX.visibility">visible</option>
        <option name="charting.axisTitleY.visibility">visible</option>
        <option name="charting.axisTitleY2.visibility">visible</option>
        <option name="charting.axisX.scale">linear</option>
        <option name="charting.axisY.scale">linear</option>
        <option name="charting.axisY2.enabled">0</option>
        <option name="charting.axisY2.scale">inherit</option>
        <option name="charting.chart">pie</option>
        <option name="charting.chart.bubbleMaximumSize">50</option>
        <option name="charting.chart.bubbleMinimumSize">10</option>
        <option name="charting.chart.bubbleSizeBy">area</option>
        <option name="charting.chart.nullValueMode">gaps</option>
        <option name="charting.chart.showDataLabels">none</option>
        <option name="charting.chart.showPercent">1</option>
        <option name="charting.chart.sliceCollapsingThreshold">0.01</option>
        <option name="charting.chart.stackMode">default</option>
        <option name="charting.chart.style">shiny</option>
        <option name="charting.drilldown">all</option>
        <option name="charting.layout.splitSeries">0</option>
        <option name="charting.layout.splitSeries.allowIndependentYRanges">0</option>
        <option name="charting.legend.labelStyle.overflowMode">ellipsisMiddle</option>
        <option name="charting.legend.placement">right</option>
        <option name="trellis.enabled">0</option>
        <option name="trellis.scales.shared">1</option>
        <option name="trellis.size">medium</option>
        <drilldown>
            <set token="form.popularity">$click.value$</set>
        </drilldown>
      </chart>
    </panel>
    <panel>
      <title>Popularity: $popularity$</title>
      <table depends="$popularity$">
        <search>
          <query>index="online_news"
| apply "online_news_popularity" as predicted_popularity
| search predicted_popularity=$popularity$
| stats values(url) as "Article's URL" by shares
| sort -shares
| eval Shares = tostring(shares,"commas")
| table "Article's URL", Shares</query>
          <earliest>0</earliest>
          <latest></latest>
        </search>
        <option name="drilldown">none</option>
      </table>
    </panel>
  </row>
</form>

Join the Splunk Community Slack to learn, troubleshoot, and make connections with fellow Splunk practitioners in real time!
Join Splunk User Groups to connect and learn in-person by region or remotely by topic or industry.
Agent Mode Engaged! Enchaining Agentic Operations with Splunk AI Assistant 2.0
Announcing Modern Navigation: A New Era of Splunk User Experience
Modernize your Splunk Apps – Introducing Python 3.13 in Splunk
