Join the Conversation
- Find Answers
- :
- Using Splunk
- :
- Dashboards & Visualizations
- :
- How to pass value of "by" field when charting "ove...
- Subscribe to RSS Feed
- Mark Topic as New
- Mark Topic as Read
- Float this Topic for Current User
- Bookmark Topic
- Subscribe to Topic
- Mute Topic
- Printer Friendly Page
- Mark as New
- Bookmark Message
- Subscribe to Message
- Mute Message
- Subscribe to RSS Feed
- Permalink
- Report Inappropriate Content
I've tried all of the built-in drill-down token options. None of them captures the value of the by field when used with over.
| chart count(TaskName) over ExitStatus by TaskName
- Mark as New
- Bookmark Message
- Subscribe to Message
- Mute Message
- Subscribe to RSS Feed
- Permalink
- Report Inappropriate Content
You're close, but whenever there's a 'split by' term, that term is actually $click.name2$.
If you haven't already, read through the Dashboard Examples app's drilldown examples.
in short:
$click.name$ is the name of the first column, or the x-axis field name in a chart.
$click.name2$ is the value of the split-by field, if there is one.
$click.value2$ is almost always a number, so it's not very useful.
$click.value$ is the value of the first cell, or the x-axis value in a chart.
- Mark as New
- Bookmark Message
- Subscribe to Message
- Mute Message
- Subscribe to RSS Feed
- Permalink
- Report Inappropriate Content
thanks! think i was overcomplicating and thinking it would work differently because I am stacking the chart.
- Mark as New
- Bookmark Message
- Subscribe to Message
- Mute Message
- Subscribe to RSS Feed
- Permalink
- Report Inappropriate Content
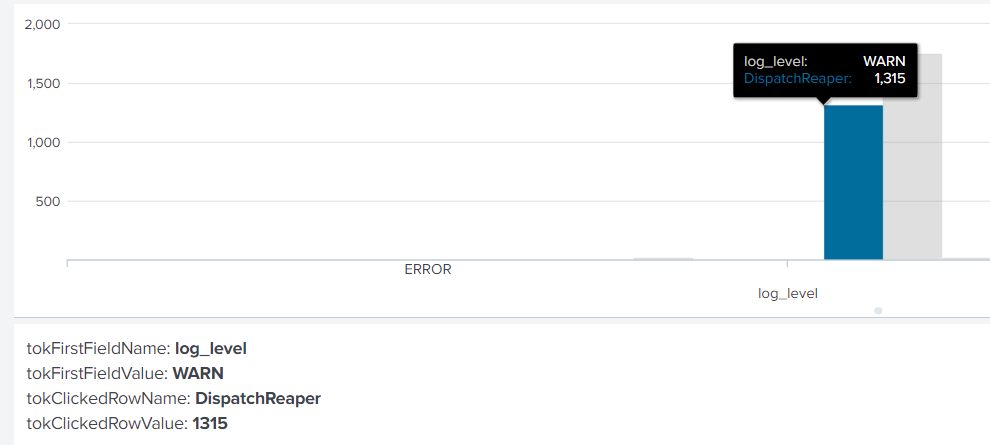
@cblanton when you use the over field1 by field2 split in chart command the field field1 becomes the first column in the table with its values. For drilldown you can use $click.name$ and $click.value$ to access both of these respectively. Based on your question seems like you are interested in this value.
You can try the following run anywhere example which fetches the first column name and value (i.e. $click.name$ and $click.value$ ) and also clicked series name and value (i.e. $click.name2$ and $click.value2$ ). Please try out and confirm.
PS: | chart count over field1 by field2 is same as | chart count by field1 field2
Following is the run anywhere example to try this.
<dashboard>
  <label>Drilldown by Field Values</label>
  <row>
    <panel>
      <chart>
        <search>
          <query>index=_internal sourcetype=splunkd log_level!=INFO
| chart count over log_level by component</query>
          <earliest>-24h@h</earliest>
          <latest>now</latest>
          <sampleRatio>1</sampleRatio>
        </search>
        <option name="charting.axisLabelsX.majorLabelStyle.overflowMode">ellipsisNone</option>
        <option name="charting.axisLabelsX.majorLabelStyle.rotation">0</option>
        <option name="charting.axisTitleX.visibility">visible</option>
        <option name="charting.axisTitleY.visibility">visible</option>
        <option name="charting.axisTitleY2.visibility">visible</option>
        <option name="charting.axisX.abbreviation">none</option>
        <option name="charting.axisX.scale">linear</option>
        <option name="charting.axisY.abbreviation">none</option>
        <option name="charting.axisY.scale">linear</option>
        <option name="charting.axisY2.abbreviation">none</option>
        <option name="charting.axisY2.enabled">0</option>
        <option name="charting.axisY2.scale">inherit</option>
        <option name="charting.chart">column</option>
        <option name="charting.chart.bubbleMaximumSize">50</option>
        <option name="charting.chart.bubbleMinimumSize">10</option>
        <option name="charting.chart.bubbleSizeBy">area</option>
        <option name="charting.chart.nullValueMode">gaps</option>
        <option name="charting.chart.showDataLabels">none</option>
        <option name="charting.chart.sliceCollapsingThreshold">0.01</option>
        <option name="charting.chart.stackMode">default</option>
        <option name="charting.chart.style">minimal</option>
        <option name="charting.drilldown">all</option>
        <option name="charting.layout.splitSeries">0</option>
        <option name="charting.layout.splitSeries.allowIndependentYRanges">0</option>
        <option name="charting.legend.labelStyle.overflowMode">ellipsisMiddle</option>
        <option name="charting.legend.mode">standard</option>
        <option name="charting.legend.placement">right</option>
        <option name="charting.lineWidth">2</option>
        <option name="trellis.enabled">0</option>
        <option name="trellis.scales.shared">1</option>
        <option name="trellis.size">medium</option>
        <drilldown>
          <set token="tokFirstFieldName">$click.name$</set>
          <set token="tokFirstFieldValue">$click.value$</set>
          <set token="tokClickedRowName">$click.name2$</set>
          <set token="tokClickedRowValue">$click.value2$</set>
        </drilldown>
      </chart>
    </panel>
  </row>
  <row>
    <panel>
      <html>
        <div>
          tokFirstFieldName: <b>$tokFirstFieldName$</b>
        </div>
        <div>
          tokFirstFieldValue: <b>$tokFirstFieldValue$</b>
        </div>
        <div>
          tokClickedRowName: <b>$tokClickedRowName$</b>
        </div>
        <div>
          tokClickedRowValue: <b>$tokClickedRowValue$</b>
        </div>
      </html>
    </panel>
  </row>
</dashboard>
PS: The tokens remain the same for similar use case with <table> visualization as well.
| makeresults | eval message= "Happy Splunking!!!"
- Mark as New
- Bookmark Message
- Subscribe to Message
- Mute Message
- Subscribe to RSS Feed
- Permalink
- Report Inappropriate Content
Built this in the deafult _audit index
<dashboard>
  <row>
    <panel>
      <table>
        <search>
          <query>
    | makeresults
| eval hr=strftime(_time,"%H")
| table hr
    </query>
          <done>
            <set token="tok">search_id</set>
          </done>
        </search>
      </table>
    </panel>
  </row>
  <row>
    <panel>
      <title>About this dashboard</title>
      <html>

        $tok$


      </html>
    </panel>
  </row>


  <row>
    <panel>
      <chart>
        <search>
          <query>index="_audit"
| chart count(action) over cache_size by $tok$</query>
          <earliest>-60m@m</earliest>
          <latest>now</latest>
          <sampleRatio>1</sampleRatio>
        </search>
        <option name="charting.axisLabelsX.majorLabelStyle.overflowMode">ellipsisNone</option>
        <option name="charting.axisLabelsX.majorLabelStyle.rotation">0</option>
        <option name="charting.axisTitleX.visibility">visible</option>
        <option name="charting.axisTitleY.visibility">visible</option>
        <option name="charting.axisTitleY2.visibility">visible</option>
        <option name="charting.axisX.scale">linear</option>
        <option name="charting.axisY.scale">linear</option>
        <option name="charting.axisY2.enabled">0</option>
        <option name="charting.axisY2.scale">inherit</option>
        <option name="charting.chart">column</option>
        <option name="charting.chart.bubbleMaximumSize">50</option>
        <option name="charting.chart.bubbleMinimumSize">10</option>
        <option name="charting.chart.bubbleSizeBy">area</option>
        <option name="charting.chart.nullValueMode">gaps</option>
        <option name="charting.chart.showDataLabels">none</option>
        <option name="charting.chart.sliceCollapsingThreshold">0.01</option>
        <option name="charting.chart.stackMode">default</option>
        <option name="charting.chart.style">shiny</option>
        <option name="charting.drilldown">none</option>
        <option name="charting.layout.splitSeries">0</option>
        <option name="charting.layout.splitSeries.allowIndependentYRanges">0</option>
        <option name="charting.legend.labelStyle.overflowMode">ellipsisMiddle</option>
        <option name="charting.legend.placement">right</option>
        <option name="trellis.enabled">0</option>
        <option name="trellis.scales.shared">1</option>
        <option name="trellis.size">medium</option>
      </chart>
    </panel>
  </row>
</dashboard>
The by clause is the token $tok$ , this is being set above in the first search query/ panel's execution

