Turn on suggestions
Auto-suggest helps you quickly narrow down your search results by suggesting possible matches as you type.
Dashboards & Visualizations
×
Are you a member of the Splunk Community?
Sign in or Register with your Splunk account to get your questions answered, access valuable resources and connect with experts!
Turn on suggestions
Auto-suggest helps you quickly narrow down your search results by suggesting possible matches as you type.
- Find Answers
- :
- Using Splunk
- :
- Dashboards & Visualizations
- :
- Re: Need to fix the row height and extend the cell...
Options
- Subscribe to RSS Feed
- Mark Topic as New
- Mark Topic as Read
- Float this Topic for Current User
- Bookmark Topic
- Subscribe to Topic
- Mute Topic
- Printer Friendly Page
- Mark as New
- Bookmark Message
- Subscribe to Message
- Mute Message
- Subscribe to RSS Feed
- Permalink
- Report Inappropriate Content
How to fix the row height and extend the cell width in Dashboard?
Renunaren
Loves-to-Learn Everything
05-29-2023
01:27 AM
Hi Team,
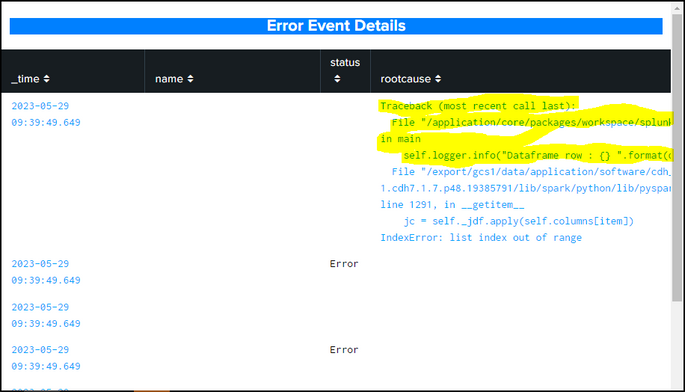
Please help us on the dashboard issue, we have a splunk xml dashboard table as shown in the below snippet.
In the root cause column the entire event is coming . We need help so that the entire event should be adjusted to 4 lines and if required the column width can extend as per the event.
- Mark as New
- Bookmark Message
- Subscribe to Message
- Mute Message
- Subscribe to RSS Feed
- Permalink
- Report Inappropriate Content
kamlesh_vaghela

SplunkTrust
05-29-2023
07:27 AM
Here I suggest displaying the trimmed value in table view and displaying the full value by expanding the table row.
This is a sample search for trimming value.
| makeresults | eval A="a
b
c
d
e
f
g
h
"
| rex field=A "(?<displayA>^.*\n.*\n.*\n.\n)"
And this is an example of "How to use Row expansion"
Let me know if you need more help on this.
Thanks
KV
If any of my replies help you to solve the problem Or gain knowledge, an upvote would be appreciated.
Get Updates on the Splunk Community!
Splunk Observability for AI
Don’t miss out on an exciting Tech Talk on Splunk Observability for AI!Discover how Splunk’s agentic AI ...
Splunk Enterprise Security 8.x: The Essential Upgrade for Threat Detection, ...
Watch On Demand the Tech Talk on November 6 at 11AM PT, and empower your SOC to reach new heights!
Duration: ...
Splunk Observability as Code: From Zero to Dashboard
For the details on what Self-Service Observability and Observability as Code is, we have some awesome content ...

