- Find Answers
- :
- Using Splunk
- :
- Dashboards & Visualizations
- :
- How to dispaly chart with start time ,duration by ...
- Subscribe to RSS Feed
- Mark Topic as New
- Mark Topic as Read
- Float this Topic for Current User
- Bookmark Topic
- Subscribe to Topic
- Mute Topic
- Printer Friendly Page
- Mark as New
- Bookmark Message
- Subscribe to Message
- Mute Message
- Subscribe to RSS Feed
- Permalink
- Report Inappropriate Content
How to dispaly chart with start time ,duration by application
HI,
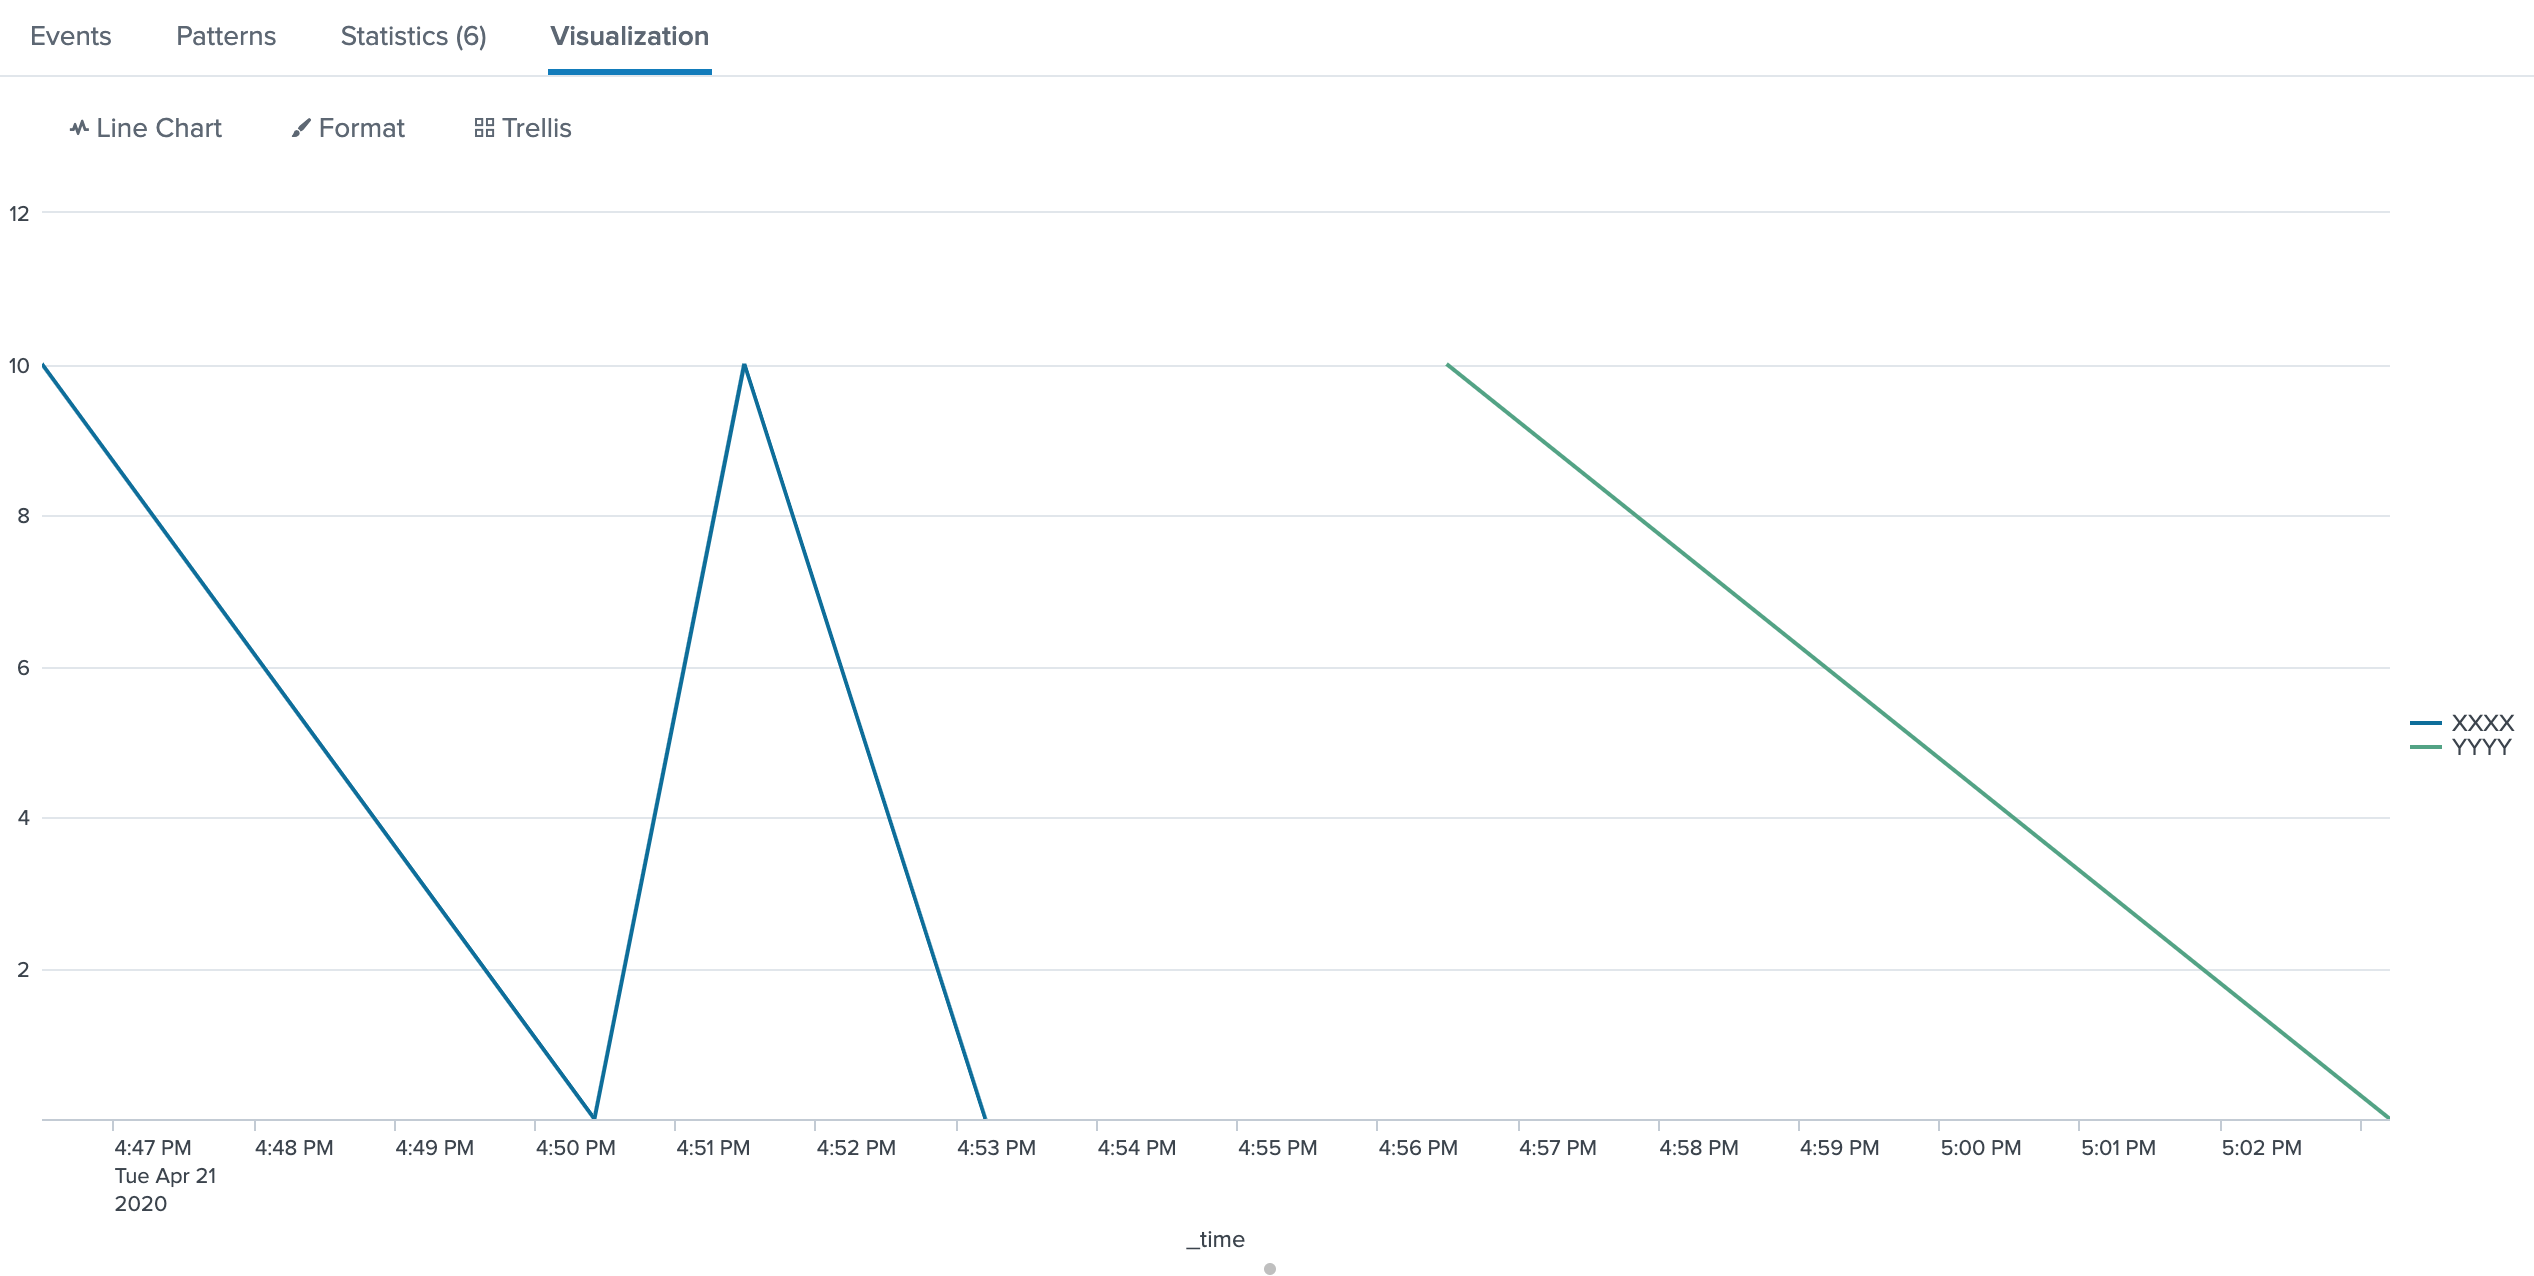
I wanted to show the Application running on line chart. Process start_time is _time and have duration and application .
Wanted to show the chart by application which starts at _time and comes down after the given duration.
For example, below is two events:
_time host duration Application
2020-04-21 16:51:29 ABC 01:43 XXXX
2020-04-21 16:46:29 ABC 03:56 XXXX
2020-04-21 16:56:29 ABC 06:43 YYYY
so, first event it should show the line goes up at 2020-04-21 16:51:29 and after 1:43 duration line goes down.
Is this possible? Please suggest.
- Mark as New
- Bookmark Message
- Subscribe to Message
- Mute Message
- Subscribe to RSS Feed
- Permalink
- Report Inappropriate Content
| makeresults
| eval _raw="_time,host,duration,Application
2020-04-21 16:51:29,ABC,01:43,XXXX
2020-04-21 16:46:29,ABC,03:56,XXXX
2020-04-21 16:56:29,ABC,06:43,YYYY"
| multikv forceheader=1
| table time,host,duration,Application
| eval duration2=tonumber(mvindex(split(duration,":"),0))*60+tonumber(mvindex(split(duration,":"),1))
| eval _time=strptime(time,"%F %T")
| eval time2=_time+duration2
| eval time=mvappend(_time,time2)
| streamstats count as session
| mvexpand time
| eval _time=time
| reverse
| streamstats current=f count as check by session
| reverse
| eval check=check*10
| table _time Application check
| xyseries _time Application check
maybe, you can do it.

- Mark as New
- Bookmark Message
- Subscribe to Message
- Mute Message
- Subscribe to RSS Feed
- Permalink
- Report Inappropriate Content
@to4kawa thank you for your reply.
Is it possible to show in line chart like for example at 4:46 PM line goes up (vertically) and it will horizontal till duration (3:56) and then at that point its comes down. ??
if possible , then please suggest how to achieve it.
- Mark as New
- Bookmark Message
- Subscribe to Message
- Mute Message
- Subscribe to RSS Feed
- Permalink
- Report Inappropriate Content
How about Area Chart?
- Mark as New
- Bookmark Message
- Subscribe to Message
- Mute Message
- Subscribe to RSS Feed
- Permalink
- Report Inappropriate Content
@to4kawa yes, we can show. Any sample query please to show area covered on that duration?
- Mark as New
- Bookmark Message
- Subscribe to Message
- Mute Message
- Subscribe to RSS Feed
- Permalink
- Report Inappropriate Content
- make
time3like same makingtime2andmvappend - modify
checkcalculation with case()
you need three values by each Application
you can do it
Customer Experience | Splunk 2024: New Onboarding Resources
Celebrate CX Day with Splunk: Take our interactive quiz, join our LinkedIn Live ...
How to Get Started with Splunk Data Management Pipeline Builders (Edge Processor & ...
