
Join the Conversation
- Find Answers
- :
- Using Splunk
- :
- Dashboards & Visualizations
- :
- Re: How to create a table listing service request,...
- Subscribe to RSS Feed
- Mark Topic as New
- Mark Topic as Read
- Float this Topic for Current User
- Bookmark Topic
- Subscribe to Topic
- Mute Topic
- Printer Friendly Page
- Mark as New
- Bookmark Message
- Subscribe to Message
- Mute Message
- Subscribe to RSS Feed
- Permalink
- Report Inappropriate Content
How to create a table listing service request, Avg responsetime, subsystem, and Error Rate/hr in a specific format?

I have to create a dashboard in the below table format. Intention is to create a dashboard showing the number of requests per hour that each service is handling, its status, responsetime, and Errors grouped by Subsystem under which each service belongs.
My sample Log:
2015-08-19 16:01:51 SubsystemName=AAA; Service=S1;version=1;duration=100ms;RequestStatus=Success
2015-08-19 16:02:51 SubsystemName=AAA; Service=S1;version=1;duration=10ms;RequestStatus=Success
2015-08-19 16:01:51 SubsystemName=AAA; Service=S2;version=1;duration=60ms;RequestStatus=FAILURE
2015-08-19 16:01:51 SubsystemName=BBB; Service=S1;version=2;duration=120ms;RequestStatus=Success
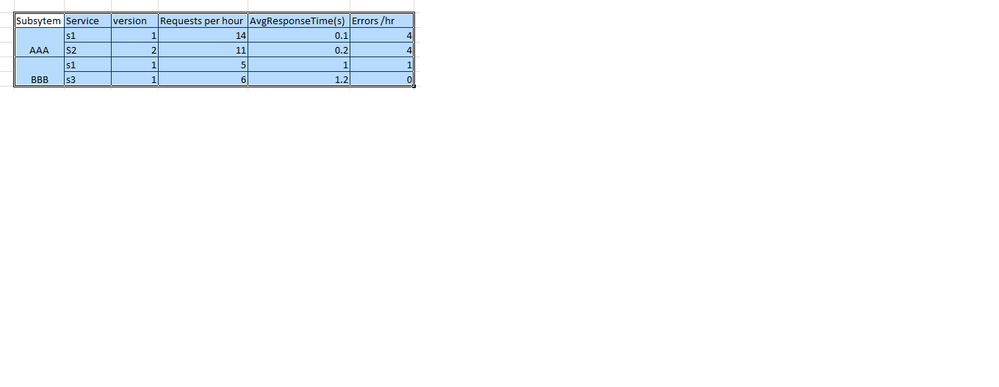
Now clicking on any service, say S1 (of Subsystem AAA), should give a timechart of TotalRequests/Errors per period for that service under subsystem AAA

- Mark as New
- Bookmark Message
- Subscribe to Message
- Mute Message
- Subscribe to RSS Feed
- Permalink
- Report Inappropriate Content

Try something like this
Your base search | bucket span=1h _time | eval duration=replace(duration,"(\d+)(\w+)","\1") | eval Fail=if(RequestStatus="FAILURE",1,0) |stats count as RequestPerHr avg(duration) as AvgResponse,sum(Fail) as ErrorCount by SubsystemName,ServiceName,ServiceVersion
For how much timerange this search is running?
- Mark as New
- Bookmark Message
- Subscribe to Message
- Mute Message
- Subscribe to RSS Feed
- Permalink
- Report Inappropriate Content

for per hour results use :
|bucket _time span=1h |stats count by _time
Add the average, min , max, requests to the query as you had done above.
- Mark as New
- Bookmark Message
- Subscribe to Message
- Mute Message
- Subscribe to RSS Feed
- Permalink
- Report Inappropriate Content
|eval event=1|stats avg(duration) as AvgResponse,count(eval(RequestStatus="FAILURE")) as ErrorCount,sum(event) as Requests by SubsystemName,ServiceName,ServiceVersion is not giving me the exact table format I wanted (not merging Subsystem in to one row).
also how to get Requests/hour,Errors/hr as well.

Join the Splunk Community Slack to learn, troubleshoot, and make connections with fellow Splunk practitioners in real time!
Join Splunk User Groups to connect and learn in-person by region or remotely by topic or industry.
Agent Mode Engaged! Enchaining Agentic Operations with Splunk AI Assistant 2.0
Announcing Modern Navigation: A New Era of Splunk User Experience
Modernize your Splunk Apps – Introducing Python 3.13 in Splunk
