Join the Conversation
- Find Answers
- :
- Using Splunk
- :
- Dashboards & Visualizations
- :
- How to create a pie chart with multiple searches?
- Subscribe to RSS Feed
- Mark Topic as New
- Mark Topic as Read
- Float this Topic for Current User
- Bookmark Topic
- Subscribe to Topic
- Mute Topic
- Printer Friendly Page
- Mark as New
- Bookmark Message
- Subscribe to Message
- Mute Message
- Subscribe to RSS Feed
- Permalink
- Report Inappropriate Content
I need to create a pie chart from two different searches/indexes.
I gave two separate queries that show the total number from my search results.
Query 1:
index="first_index"
| stats count by auth.metadata.role_name
| rex field=auth.metadata.role_name
| dedup auth.metadata.role_name
| stats count
Query 2:
index="second_index" sourcetype="mysource" (request.path="my/path/*" OR request.path="my/path/sign/*") NOT (request.path="not/my/path" OR request.path="also/not/my/path") response
| eval expired=if((now() > 'response.data.expiration'),1,0)
| table _time, request.data.common_name, expired, auth.metadata.role_name
| rename request.data.common_name as cn
| search "auth.metadata.role_name"="my_role_name"
| table cn
| dedup cn
| stats count
Where query 1 is = 100%
How can I make query 2 show a percentage using query 1 as the 100%
i.e if query 1 stats count = 150
and query 2 stats count = 75
then query 2 should print 50 %
Thanks
- Mark as New
- Bookmark Message
- Subscribe to Message
- Mute Message
- Subscribe to RSS Feed
- Permalink
- Report Inappropriate Content
count1 exists in one event and count2 exists in the other event which is why the calculation doesn't work. You could try
| chart count by index- Mark as New
- Bookmark Message
- Subscribe to Message
- Mute Message
- Subscribe to RSS Feed
- Permalink
- Report Inappropriate Content
Try something like this - include the index field on stats and table commands so it isn't lost
index="first_index"
| stats count by auth.metadata.role_name index
| rex field=auth.metadata.role_name
| dedup auth.metadata.role_name
| append
[search index="second_index" sourcetype="mysource" (request.path="my/path/*" OR request.path="my/path/sign/*") NOT (request.path="not/my/path" OR request.path="also/not/my/path") response
| eval expired=if((now() > 'response.data.expiration'),1,0)
| table _time, request.data.common_name, expired, auth.metadata.role_name index
| rename request.data.common_name as cn
| search "auth.metadata.role_name"="my_role_name"
| table cn index
| dedup cn ]
| stats count by index- Mark as New
- Bookmark Message
- Subscribe to Message
- Mute Message
- Subscribe to RSS Feed
- Permalink
- Report Inappropriate Content
Hello,
Thanks for the tip, it was helpful.
Although I got a different result when I executed and did not get the percentage, but I did some twakings to finally get the percentage using this
index="first_index" sourcetype="mysource" (request.path="my/path/*" OR request.path="my/other/path/*") NOT (request.path="not/my/path" OR request.path="not/my/path") response
| eval expired=if((now() > 'response.data.expiration'),1,0)
| table _time, request.data.common_name, expired, auth.metadata.role_name
| rename request.data.common_name as cn
| search "auth.metadata.role_name"="myrole"
| stats count as count1
| appendcols
[ search index="second_index"
| stats count by auth.metadata.role_name
| dedup auth.metadata.role_name
| stats count as count2]
| eval PercenCount=round((count1/count2)*100)
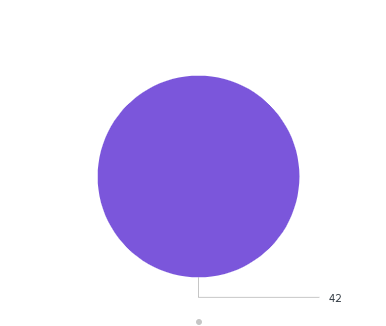
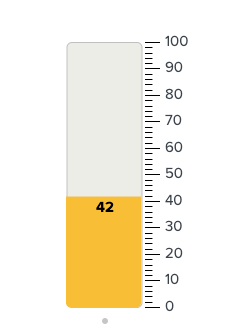
I see the correct percentage. However, when I select "pie chart" from the viaualization result, I only see one circle with the percentage, instead of seeing two pies. is there a way to make the pie chart show?
I get the expected result when I use filler gauge, but not sure why not for pie?
Thanks
- Mark as New
- Bookmark Message
- Subscribe to Message
- Mute Message
- Subscribe to RSS Feed
- Permalink
- Report Inappropriate Content
count1 exists in one event and count2 exists in the other event which is why the calculation doesn't work. You could try
| chart count by index- Mark as New
- Bookmark Message
- Subscribe to Message
- Mute Message
- Subscribe to RSS Feed
- Permalink
- Report Inappropriate Content
Thanks that did the trick


