- Splunk Answers
- :
- Using Splunk
- :
- Dashboards & Visualizations
- :
- How to create a dynamic drop-down on your own time...
- Subscribe to RSS Feed
- Mark Topic as New
- Mark Topic as Read
- Float this Topic for Current User
- Bookmark Topic
- Subscribe to Topic
- Mute Topic
- Printer Friendly Page
- Mark as New
- Bookmark Message
- Subscribe to Message
- Mute Message
- Subscribe to RSS Feed
- Permalink
- Report Inappropriate Content
How to create a dynamic drop-down on your own time field ?
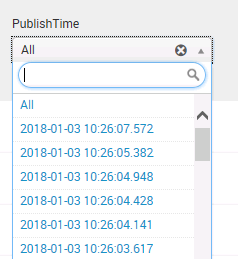
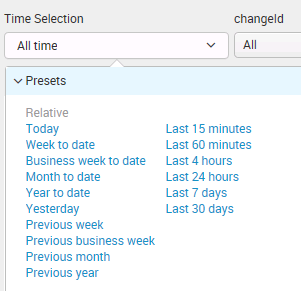
I have a field in logs (PublishTime) which is different from _time. To display the same in splunk I have created a dropdown that shows the time [snip #1]. However, I want the dropdwon similar to what we have for _time [snip #2]. Is there any way to achieve below?
- Mark as New
- Bookmark Message
- Subscribe to Message
- Mute Message
- Subscribe to RSS Feed
- Permalink
- Report Inappropriate Content
Things get trick when trying to use a timepicker for anything other than _time. Does your event actually have two legitimate timestamps (event time and PublishTime), or should PublishTime be the time of the event instead? If the latter, consider working to get that fixed at index time.
But to answer the actual question posted, you can do some gross things with searches that set tokens (epoch time for earliest/latest) based on other tokens (timepicker), and use the former in your search later. Here is a run anywhere example of this in action:
<form>
  <label>610251</label>
  <fieldset submitButton="false">
    <input type="time" token="timepicker">
      <label></label>
      <default>
        <earliest>-24h@h</earliest>
        <latest>now</latest>
      </default>
    </input>
  </fieldset>
  <search id="set_earliest_latest_epoch">
    <query>| makeresults | addinfo | eval earliest_tok=info_min_time, latest_search=if(info_max_time="+Infinity", "", "PublishTime<".info_max_time)</query>
    <earliest>$timepicker.earliest$</earliest>
    <latest>$timepicker.latest$</latest>
    <done>
      <condition match="'job.resultCount' == 1">
        <set token="earliest_tok">$result.earliest_tok$</set>
        <set token="latest_search_tok">$result.latest_search$</set>
      </condition>
    </done>
  </search>
  <row>
    <panel>
      <table>
        <search>
          <query>index=_internal | eval PublishTime=relative_time(_time, "-5min") | search PublishTime>=$earliest_tok$ $latest_search_tok$ | stats count</query>
          <sampleRatio>1</sampleRatio>
        </search>
        <option name="count">20</option>
        <option name="dataOverlayMode">none</option>
        <option name="drilldown">none</option>
        <option name="percentagesRow">false</option>
        <option name="rowNumbers">false</option>
        <option name="totalsRow">false</option>
        <option name="wrap">true</option>
      </table>
    </panel>
    <panel>
      <table>
        <search>
          <query>index=_internal | stats count</query>
          <earliest>$timepicker.earliest$</earliest>
          <latest>$timepicker.latest$</latest>
          <sampleRatio>1</sampleRatio>
        </search>
        <option name="count">20</option>
        <option name="dataOverlayMode">none</option>
        <option name="drilldown">none</option>
        <option name="percentagesRow">false</option>
        <option name="rowNumbers">false</option>
        <option name="totalsRow">false</option>
        <option name="wrap">true</option>
      </table>
    </panel>
  </row>
</form>


