- Find Answers
- :
- Using Splunk
- :
- Dashboards & Visualizations
- :
- How to create a dashboard that tracks 1 or 2 log f...
- Subscribe to RSS Feed
- Mark Topic as New
- Mark Topic as Read
- Float this Topic for Current User
- Bookmark Topic
- Subscribe to Topic
- Mute Topic
- Printer Friendly Page
- Mark as New
- Bookmark Message
- Subscribe to Message
- Mute Message
- Subscribe to RSS Feed
- Permalink
- Report Inappropriate Content
you are to create a dashboard that tracks log feeds
so I imagine it would look like a table and have things like
log feed | last seen and it would be colored based on some threshhold (last seen 24 hours red, last seen 10 mins green). It will include:
- color for categorizing critical levels
- email alerting
- can start with small features
- Mark as New
- Bookmark Message
- Subscribe to Message
- Mute Message
- Subscribe to RSS Feed
- Permalink
- Report Inappropriate Content
Yes - the minutesago calculation allows the colours to be set appropriately
- Mark as New
- Bookmark Message
- Subscribe to Message
- Mute Message
- Subscribe to RSS Feed
- Permalink
- Report Inappropriate Content
step 1 - when you run this query on search, do you get the logs/events you wanted?
step 2 - if yes, then, create a dashboard with this query and then you can plan about the coloring.
step 3 - if no, then, lets troubleshoot this query until you find out your expected logs.
Sekar
PS - If this or any post helped you in any way, pls consider upvoting, thanks for reading !
- Mark as New
- Bookmark Message
- Subscribe to Message
- Mute Message
- Subscribe to RSS Feed
- Permalink
- Report Inappropriate Content
The following is what I need to achieve:
you are to create a dashboard that tracks log feeds
so I imagine it would look like a table and have things like
log feed | last seen and it would be colored based on some threshhold (last seen 24 hours red, last seen 10 mins green). It will include:
- color for categorizing critical levels
- email alerting
- can start with small features
I have this splunk Query:
| tstats latest(_time) as latest where index=* earliest=-48h by host | eval minutesago=round((now()-latest)/60,0)
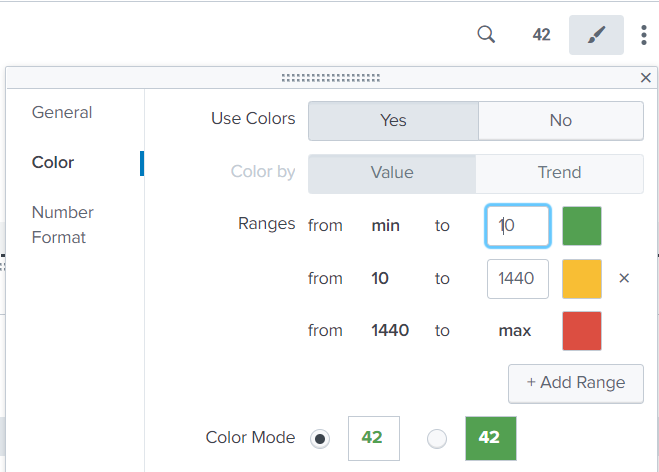
DO you think this query would be very proper for what I am trying to achieve? I have some issues with the color part of it. I did try using visualization single value 42 for the color but I do not see it. I need your help all it.
- Mark as New
- Bookmark Message
- Subscribe to Message
- Mute Message
- Subscribe to RSS Feed
- Permalink
- Report Inappropriate Content
There as always with splunk a number of different ways to do this. For example, you could have a panel for each log feed with a "<single>" element in each. The data in the single could be driven by the number of days since the latest entry in the log. The number displayed could be coloured depending on its value giving you the various levels of threshold you want.
- Mark as New
- Bookmark Message
- Subscribe to Message
- Mute Message
- Subscribe to RSS Feed
- Permalink
- Report Inappropriate Content
Please what would be the Splunk query to achieve it?
- Mark as New
- Bookmark Message
- Subscribe to Message
- Mute Message
- Subscribe to RSS Feed
- Permalink
- Report Inappropriate Content
Please how do you do the coloring? Do you do it by editing XML?
- Mark as New
- Bookmark Message
- Subscribe to Message
- Mute Message
- Subscribe to RSS Feed
- Permalink
- Report Inappropriate Content
Yes, edit the XML Add a couple of options to the single
<option name="rangeValues">[0,10,20,30]</option>
<option name="rangeColors">["0x00FF00","0xFFFF00","0x0000FF","0xFF0000"]</option>
You choose appropriate values and colours
- Mark as New
- Bookmark Message
- Subscribe to Message
- Mute Message
- Subscribe to RSS Feed
- Permalink
- Report Inappropriate Content
I got warning message when I added those couple of lines to the XML. Why do I get the warning error message when I edit XML for the colors?
- Mark as New
- Bookmark Message
- Subscribe to Message
- Mute Message
- Subscribe to RSS Feed
- Permalink
- Report Inappropriate Content
Thanks. What about the splunk queries to monitor these logs in 24 hours and also 10 minutes.
- Mark as New
- Bookmark Message
- Subscribe to Message
- Mute Message
- Subscribe to RSS Feed
- Permalink
- Report Inappropriate Content
| eval secondsago=now()-_timeSo you can set your ranges to be 10*60 (for 10 minutes) and 24*60*60 (for 24 hours) etc.
- Mark as New
- Bookmark Message
- Subscribe to Message
- Mute Message
- Subscribe to RSS Feed
- Permalink
- Report Inappropriate Content
Please do I have to include something like this before the eval command?
index=main source=windowseventlog sourcetype=access_combined_wcookie | eval secondsago=now()-_time
Please how would to include the splunk time range you specified in your last command in the querries?
- Mark as New
- Bookmark Message
- Subscribe to Message
- Mute Message
- Subscribe to RSS Feed
- Permalink
- Report Inappropriate Content
The first part is your search. This retrieves (matching) event records from your index. The eval will create an additional field for each event for you to use. It would probably be better to do it this way
index=main source=windowseventlog sourcetype=access_combined_wcookie
| head 1
| eval minutesago=round((now()-_time)/60,0)
Since you are interested in when the latest event occurred. Splunk should have put a timestamp on each record in the _time field. This eval calculates the number of minutes ago that the event was based on this timestamp.
In your single, either by editing the XML or by modifying the format of the single in the dashboard editor, your set the range for the different colours you want e.g 0, 10, 30,, 60 etc. for 10 minute, 30 minute, 60 minute thresholds
- Mark as New
- Bookmark Message
- Subscribe to Message
- Mute Message
- Subscribe to RSS Feed
- Permalink
- Report Inappropriate Content
Thanks. what splunk queries would you add to the previous query you wrote to specify different colors for 24 hours and then for 10 mins?
- Mark as New
- Bookmark Message
- Subscribe to Message
- Mute Message
- Subscribe to RSS Feed
- Permalink
- Report Inappropriate Content
The query is OK - you configure the colours by editing the dashboard and formatting the single
- Mark as New
- Bookmark Message
- Subscribe to Message
- Mute Message
- Subscribe to RSS Feed
- Permalink
- Report Inappropriate Content
Thanks. I configured the single value 42 for colors but the green color is not showing. How do I get the green color to be showing for 24 hours threshold and how do I get the red color to show for the 10 minutes threshold? Please assist with queries or visualization configurations.
- Mark as New
- Bookmark Message
- Subscribe to Message
- Mute Message
- Subscribe to RSS Feed
- Permalink
- Report Inappropriate Content
Thanks. I wrote this query:
| tstats latest(_time) as latest where index=* earliest=-24h by host
| eval recent = if(latest > relative_time(now(),"-5m"),1,0), realLatest = strftime(latest,"%c")
| where recent=0
Question: Do you think this query will answer my original question of:
Writing a query that will be used to create a dashboard tracking 1 or 2 log feeds that would be colored based on some threshhold (last seen 24 hours red, last seen 10 mins green) ? Please add to the query if there is anything missing. I added the lines for colors in the XML edit for the dashboard but it is giving me validation error message. Your help would be appreciated.
- Mark as New
- Bookmark Message
- Subscribe to Message
- Mute Message
- Subscribe to RSS Feed
- Permalink
- Report Inappropriate Content
If you want to use tstats try:
| tstats latest(_time) as latest where index=* earliest=-48h by host
| eval minutesago=round((now()-latest)/60,0)
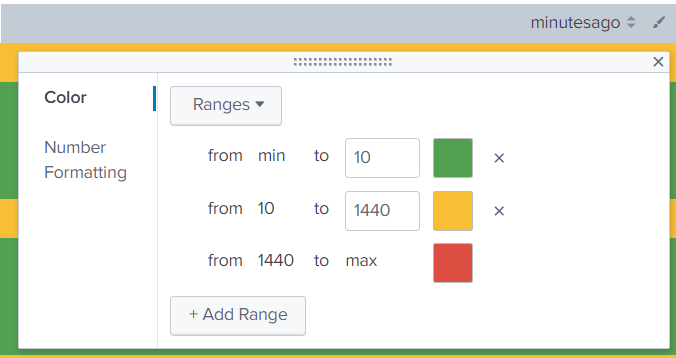
Then set the colour ranges for the minutesago column as appropriate
Obviously, this still only goes back 48 hours so if your latest entry is older than that, you would not see it
- Mark as New
- Bookmark Message
- Subscribe to Message
- Mute Message
- Subscribe to RSS Feed
- Permalink
- Report Inappropriate Content
Thanks. Do I also set the minuteago for 10 mins just like the 48 hours?
- Mark as New
- Bookmark Message
- Subscribe to Message
- Mute Message
- Subscribe to RSS Feed
- Permalink
- Report Inappropriate Content
Yes - the minutesago calculation allows the colours to be set appropriately
- Mark as New
- Bookmark Message
- Subscribe to Message
- Mute Message
- Subscribe to RSS Feed
- Permalink
- Report Inappropriate Content
I also created 2 Alerts in Splunk web to send me an email based on the threshold of 24 hours and 10 minutes. Is that the correct way of doing it? Please let me know.
- Mark as New
- Bookmark Message
- Subscribe to Message
- Mute Message
- Subscribe to RSS Feed
- Permalink
- Report Inappropriate Content

