Are you a member of the Splunk Community?
- Find Answers
- :
- Using Splunk
- :
- Dashboards & Visualizations
- :
- Re: How do you visualize a topology with mentioned...
- Subscribe to RSS Feed
- Mark Topic as New
- Mark Topic as Read
- Float this Topic for Current User
- Bookmark Topic
- Subscribe to Topic
- Mute Topic
- Printer Friendly Page
- Mark as New
- Bookmark Message
- Subscribe to Message
- Mute Message
- Subscribe to RSS Feed
- Permalink
- Report Inappropriate Content
Hi Splunkers,
I have below a type of data in our log files:
System export of 3.FR successfully transferred to 2.SP
System Import successfully ended on 3.FR from export of 2.SP with exit code 0
System export successfully ended on 2.SP with exit code 0
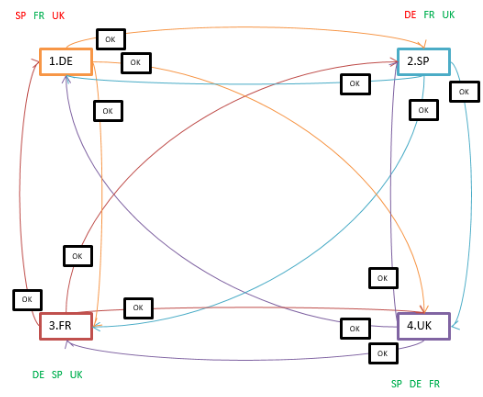
which means that "A Line will be drawn towards from 3.FR to 2.SP boxes with OK and vice versa.
Please refer to the below image for more info.
Could you please suggest which approach needs to follow in order to achieve the below topology graph?
I am trying a lot, but not succeeding. Any help will be appreciated. Thanks.
- Mark as New
- Bookmark Message
- Subscribe to Message
- Mute Message
- Subscribe to RSS Feed
- Permalink
- Report Inappropriate Content
You need a custom visualization (AKA modviz). Here are some that you can try:
https://splunkbase.splunk.com/app/4346/
https://splunkbase.splunk.com/app/3762/
https://splunkbase.splunk.com/app/3112/
https://splunkbase.splunk.com/app/277/
https://splunkbase.splunk.com/app/3379/
https://splunkbase.splunk.com/app/3843/
https://splunkbase.splunk.com/app/3767/
ALSO. Please check out the Splunk Business Flow beta, which will probably also meet your needs (and if not, you can influence the evolution of the project):
https://www.splunk.com/en_us/software/splunk-next.html
- Mark as New
- Bookmark Message
- Subscribe to Message
- Mute Message
- Subscribe to RSS Feed
- Permalink
- Report Inappropriate Content
Hi All/ @woodcock
I am using below SPL:
host="ITEM-System" sourcetype="System"
 | rex "System \s+(?<action>\w+) of (?<from_server>.*) (?<result>successfully|failed) transferred to (?<to_server>.*)"
 | rex "System \s+(?<action>\w+) (?<result>successfully|failed) ended on (?<from_server>.*) from export of (?<to_server>.*) with exit code 0"|eval linkType=case(action="export","licensing",action="Import","search"), result="OK"|table from_server action to_server result linkType| where action!=" "
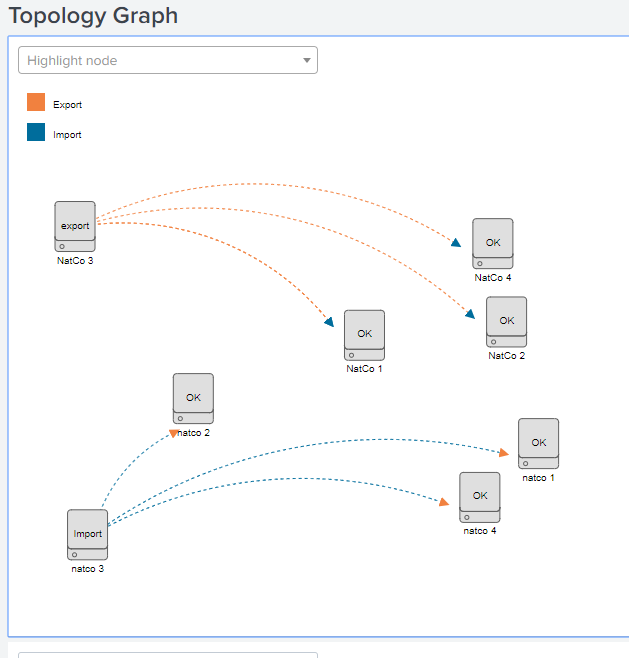
and genrated the attached visualization trough with Network Topology - Custom Visualization App.
Could you please suggest more on SPL for better display.
Thanks.
- Mark as New
- Bookmark Message
- Subscribe to Message
- Mute Message
- Subscribe to RSS Feed
- Permalink
- Report Inappropriate Content
You are just going to have to play around with it. I have never used them.
- Mark as New
- Bookmark Message
- Subscribe to Message
- Mute Message
- Subscribe to RSS Feed
- Permalink
- Report Inappropriate Content
Thanks a lot @woodcock . 🙂
- Mark as New
- Bookmark Message
- Subscribe to Message
- Mute Message
- Subscribe to RSS Feed
- Permalink
- Report Inappropriate Content
Sure, I will try with mentioned apps and get back to you. Thank you very much for your suggestion.


