Join the Conversation
- Find Answers
- :
- Using Splunk
- :
- Dashboards & Visualizations
- :
- Re: How do I display colored text in a single valu...
- Subscribe to RSS Feed
- Mark Topic as New
- Mark Topic as Read
- Float this Topic for Current User
- Bookmark Topic
- Subscribe to Topic
- Mute Topic
- Printer Friendly Page
- Mark as New
- Bookmark Message
- Subscribe to Message
- Mute Message
- Subscribe to RSS Feed
- Permalink
- Report Inappropriate Content
I am very new to Splunk and XML, and I am trying to display the status of my Jenkin's jobs.
Here is my query:
index=jenkins |spath job_name | search job_name="job/utl-dataflow-check-DEV2/" | sort -_time | stats latest(job_result) as status, latest(_time) as dev2t | eval Dev2Time=strftime(dev2t, "%Y-%m-%d: %H:%M:%S") | fields status Dev2Time | head 1
This displays the status of the query in Black now.
The "status" is either SUCCESS, FAILURE, or some other value if the job did not run within the time range. I want to display the environment name(in this case DEV2 as the job name indicated) instead of the status in RED if the status is FAILURE, display it in GREEN if the status is SUCCESS, and display in GREY is the status is something else.
I could not find useful info yet. Thanks.
- Mark as New
- Bookmark Message
- Subscribe to Message
- Mute Message
- Subscribe to RSS Feed
- Permalink
- Report Inappropriate Content
adding screenshot here as seems like i cant add screenshot while editing:
- Mark as New
- Bookmark Message
- Subscribe to Message
- Mute Message
- Subscribe to RSS Feed
- Permalink
- Report Inappropriate Content
- Mark as New
- Bookmark Message
- Subscribe to Message
- Mute Message
- Subscribe to RSS Feed
- Permalink
- Report Inappropriate Content
Thanks for the code. I tested it and worked for the green.
  <single>
    <title>$dev2title$</title>
    <search>
      <query>index=jenkins |spath job_name | search job_name="job/utl-dataflow-check-DEV2/" | sort -_time | stats latest(job_result) as dev2s, latest(_time) as dev2t | eval Dev2Time=strftime(dev2t, "%Y-%m-%d: %H:%M:%S") | eval dev2value=if(dev2s==SUCCESS,"good","bad") | fields dev2s Dev2Time | head 1 | eval range=if(dev2value=="bad", "severe", "low")</query>
      <done>
        <set token="dev2title">$result.Dev2Time$</set>
      </done>
      <earliest>-4h@h</earliest>
      <latest>now</latest>
      <refresh>2m</refresh>
      <refreshType>delay</refreshType>
    </search>
    <option name="drilldown">none</option>
    <option name="colorBy">value</option>
    <option name="colorMode">none</option>
    <option name="drilldown">none</option>
    <option name="numberPrecision">0</option>
    <option name="rangeColors">["0x65a637","0x6db7c6","0xf7bc38","0xf58f39","0xd93f3c"]</option>
    <option name="rangeValues">[0,30,70,100]</option>
    <option name="showSparkline">1</option>
    <option name="showTrendIndicator">1</option>
    <option name="trellis.enabled">0</option>
    <option name="trellis.scales.shared">1</option>
    <option name="trellis.size">medium</option>
    <option name="trendColorInterpretation">standard</option>
    <option name="trendDisplayMode">absolute</option>
    <option name="unitPosition">after</option>
    <option name="useColors">0</option>
    <option name="useThousandSeparators">1</option>
  </single>
Somehow, I always get text displayed in green. I tested the query, when dev2value is "FAILURE", "severe" was picked up, but the display is still green which is "low".
- Mark as New
- Bookmark Message
- Subscribe to Message
- Mute Message
- Subscribe to RSS Feed
- Permalink
- Report Inappropriate Content
hmmm, interesting, try to run the search, modify visualizations to "single value" and save as dashboard panel, do not edit visualization parameters from gui
- Mark as New
- Bookmark Message
- Subscribe to Message
- Mute Message
- Subscribe to RSS Feed
- Permalink
- Report Inappropriate Content
Sure. I changed the visualization to:
fields dev2s | eval range=if(dev2value=="bad", "severe", "low")
Just the status which is FAILURE for this environment, it still picks up "low".
- Mark as New
- Bookmark Message
- Subscribe to Message
- Mute Message
- Subscribe to RSS Feed
- Permalink
- Report Inappropriate Content
I also tried to flip the logic and get red display all the time, including SUCCESS.
- Mark as New
- Bookmark Message
- Subscribe to Message
- Mute Message
- Subscribe to RSS Feed
- Permalink
- Report Inappropriate Content
What I did is to check the dev2s directly, like this:
eval range=if(dev2s=="FAILURE", "severe", "low")
This time, it picked up the right color. Thanks for your help!
- Mark as New
- Bookmark Message
- Subscribe to Message
- Mute Message
- Subscribe to RSS Feed
- Permalink
- Report Inappropriate Content
it seems eval range=if(dev2value=="bad", "severe", "low") always picks up the last value...
- Mark as New
- Bookmark Message
- Subscribe to Message
- Mute Message
- Subscribe to RSS Feed
- Permalink
- Report Inappropriate Content
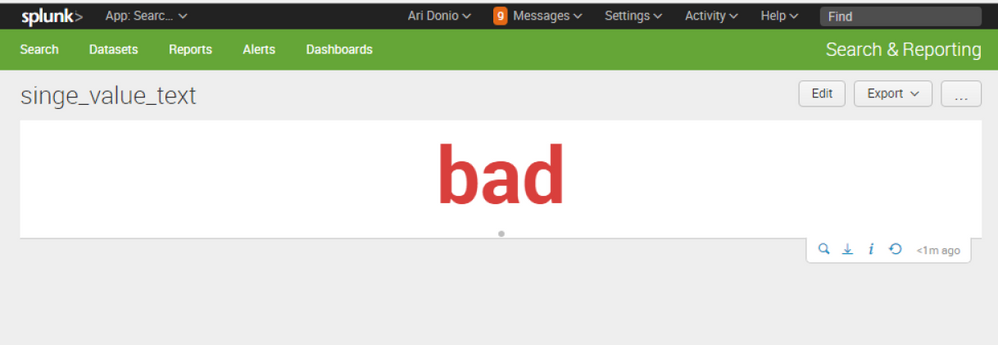
see here:
https://answers.splunk.com/answers/525809/change-single-value-color-based-on-textual-value.html
here is an xml example, run couple times as it randomly generates good or bad
<dashboard>
  <label>singe_value_text</label>
  <row>
    <panel>
      <single>
        <search>
          <query>| gentimes start="08/01/2018:00:00:00" end="08/9/2018:10:00:00" increment=1h
| eval _time = starttime
| eval value = random()%2
| eval next_value = if(value=1,"good","bad")
| stats last(next_value) as good_or_bad
| eval range=if(good_or_bad=="bad", "severe", "low")</query>
          <earliest>-24h@h</earliest>
          <latest>now</latest>
          <sampleRatio>1</sampleRatio>
        </search>
        <option name="colorBy">value</option>
        <option name="colorMode">none</option>
        <option name="drilldown">none</option>
        <option name="numberPrecision">0</option>
        <option name="rangeColors">["0x65a637","0x6db7c6","0xf7bc38","0xf58f39","0xd93f3c"]</option>
        <option name="rangeValues">[0,30,70,100]</option>
        <option name="showSparkline">1</option>
        <option name="showTrendIndicator">1</option>
        <option name="trellis.enabled">0</option>
        <option name="trellis.scales.shared">1</option>
        <option name="trellis.size">medium</option>
        <option name="trendColorInterpretation">standard</option>
        <option name="trendDisplayMode">absolute</option>
        <option name="unitPosition">after</option>
        <option name="useColors">0</option>
        <option name="useThousandSeparators">1</option>
      </single>
    </panel>
  </row>
</dashboard>
hope it helps

